MetaTrader 5 Help

The Trading Platform is the trader's working tool, providing all the necessary features for a successful online trading. It includes trading, technical analysis of prices and fundamental analysisautomated trading and trading from mobile devices. In addition to Forex symbols, options futures and stocks can be traded from the platform.

Common

Odoo • Text and Image

Common

Appearance and properties of each chart in the trading platform can be configured individually. Click " Properties  Properties" in the  Charts  menu or in the chart context menu.

The common properties of a chart can be set up from this tab:

  • Bar chart — show the chart as a sequence of bars.
  • Candlestick — show the chart as a sequence of Japanese candlesticks.
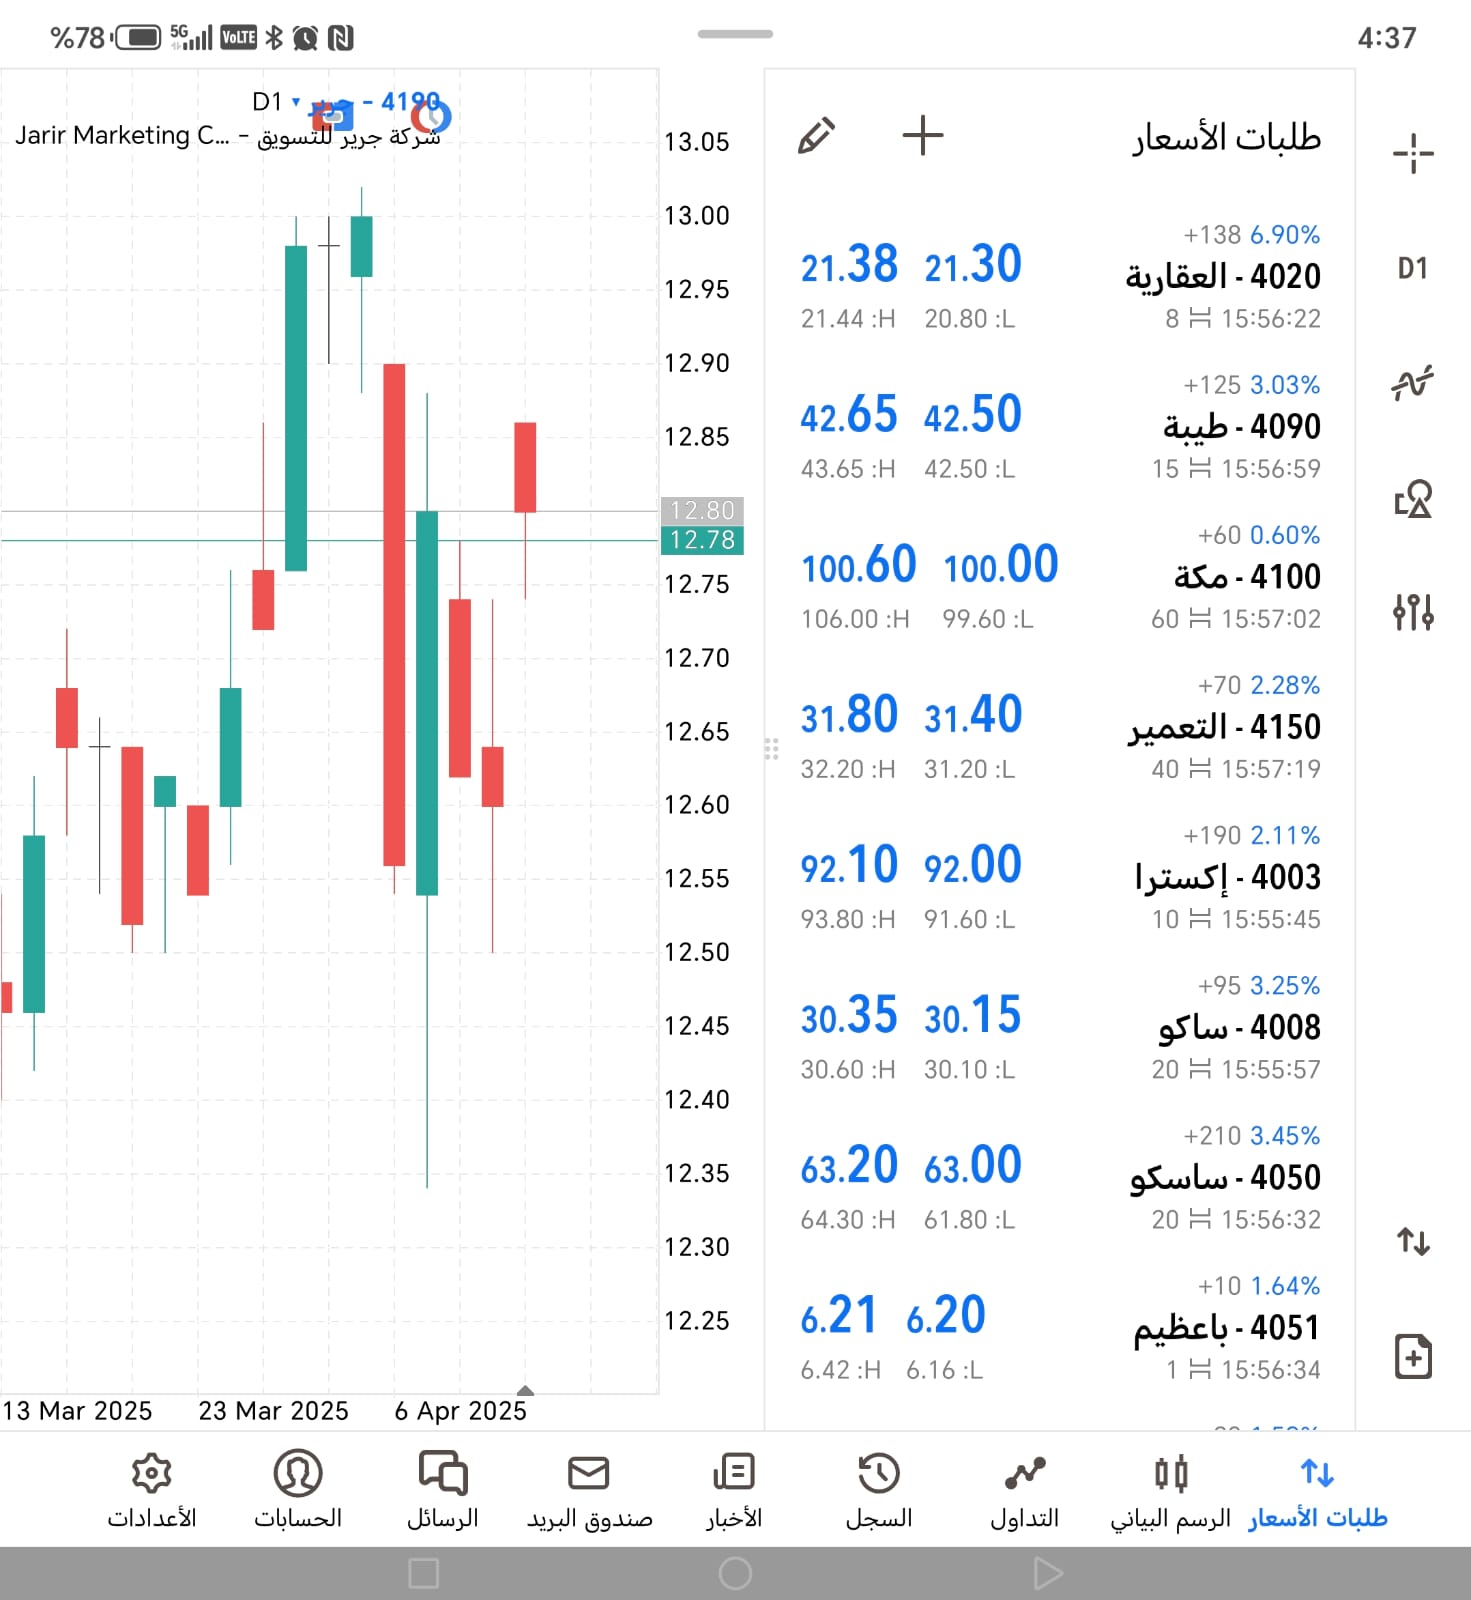
  • Chart shift — shift the chart from the right edge of the window to the shift mark. The chart shift mark (a gray triangle at the top of the window) can be dragged horizontally using a mouse within 10% to 50% of the window size.
  • Chart auto scroll — enable/disable automatic chart shift to the left with the beginning of new bar formation. If the option is enabled, the chart always shows the last bar.
  • Scale — use a scaler to adjust the chart scale. This also changes the chart scale in the preview window located in the left part of the properties window.
  • Scale fix one to one — fix the chart scale as "one to one" (the size of one pip of the vertical axis in pixels is equal to the distance between the bar axes in pixels). In this case the "Scale fix" option is enabled automatically, and a scroll bar appears at the right side of the window that allows to move the chart vertically. This mode allows drawing precise geometrical constructions.
  • Scale fix — fix the chart scale vertically. When this option is selected, additional scaling parameters "Fixed maximum" and "Fixed minimum" for setting the minimum and maximum value of the price scale become active.
  • Scale points per bar — fix the chart scale by the ratio of points on the vertical axis to one bar. Specify the number of bars in the "Points per bar" field.
  • Line — show the chart as a broken line that connects close prices of bars.

Show

Odoo • Text and Image

Show

T he tab contains options of information display on the chart:

  • Sh ow ticker — show/hide the line containing the trading symbol name, the timeframe and a custom comment.
  • Show OHLC — show/hide the OHLC line. An additional data line appears at the top left of the window. The last bar prices are displayed in addition to the symbol name and chart timeframe. Price are shown in the following format: OPEN, HIGH, LOW and CLOSE (OHLC) — bar open price, the highest bar price, the lowest bar price, and bar close price, respectively. Thus, the exact value of the latest bar is always shown on the screen. This option is also effective for the data line in the indicator sub-windows.
  • Show quick trading buttons — show/hide buttons that open the quick trade panel and the depth of market on the chart.
  • Show Bid price line — show/hide the Bid price level of the latest quote. A horizontal line corresponding to the Bid price of the latest quote appears on the chart.
  • Show Ask price line — show/hide the Ask price level of the latest quote. Bars in the platform are formed based on Bid prices (or Last prices if the depth of market is available for the instrument). However, the Ask price is always used to open long positions and close short ones. The Ask price is not displayed on the chart, so it cannot be seen. To have a more precise control over trading, enable the "Show Ask price line" parameter. An additional horizontal line corresponding to the Ask price of the latest quote appears on the chart.
  • Show Last price line — show/hide the level of the price at which the latest trade was executed. This line can only be displayed if the appropriate symbol price is provided by the server.
  • Show period separators — show/hide period separators. Date and time of each bar are displayed on the horizontal axis of the chart. The scale interval of the horizontal axis is equal to the selected timeframe. The "Show period separators" option draws additional vertical lines corresponding to the larger period (timeframe) borders. Daily separators are drawn for M1 to H1 charts, weekly separators are shown for H4, monthly appear for D1 and year separators are used for W1 and MN1 charts.
  • Show grid — show/hide grid in the chart window.
  • Show tick volumes — show/hide the volume chart calculated based on the number of ticks at the bottom of the window. The option is unavailable with scale fix enabled.
  • Show real volumes — show/hide the volume chart calculated based on the actual number of executed trades. The option is only available for exchange-traded instruments.
  • Show object descriptions — show/hide object descriptions on the chart. If the option is enabled and objects on the chart are provided with descriptions, these descriptions appear straight on the chart.
  • Show trade levels — show/hide the price levels where a position was opened or a pending order was placed, as well as the levels of Stop Loss and Take Profit. The option is only valid if the same option is enabled in the platform settings.
  • Show trade history — show/hide on the chart entries and exits for the appropriate instrument. For more details, please visit section "How to Analyze Your Entries on the Chart". The option affects the specific selected chart. To set a default property value for all charts, use platform settings.

Colors 

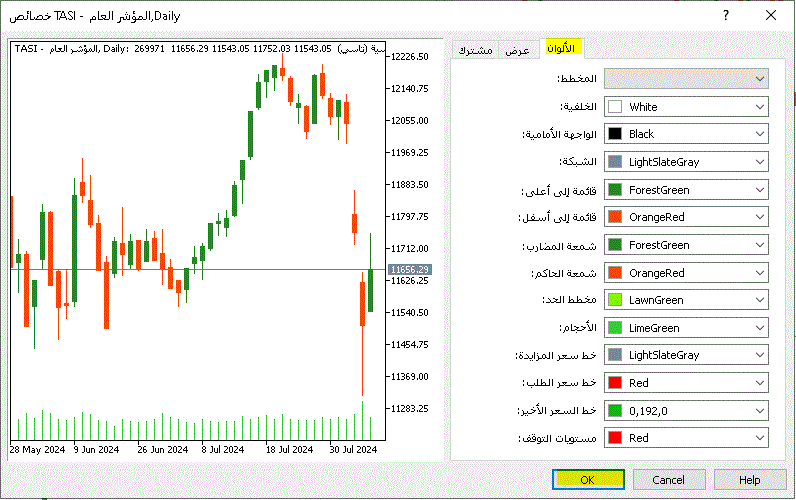
From this tab, you can set up the color display of the chart and its elements:

  • Scheme — select a predefined chart color scheme. Four color schemes are available: "Yellow on Black", "Green on Black", "Black on White" and "Color on White". Custom color schemes can be saved using templates.
  • Background — the chart background color;
  • Text — the color of axes, scale and OHLC line;
  • Grid — grid color;
  • Bar up — the color of an up bar, tails and edges of a bullish candlestick's body;
  • Bar down — the color of a down bar, tails and edges of a bearish candlestick's body;
  • Bull candle — the color of the bullish candlestick body;
  • Bear candle — the color of the bearish candlestick body;
  • Line chart — the color of the chart line and Doji candlesticks;
  • Volumes — the color of volumes and position opening levels;
  • Bid price line — the color of the Bid price line;
  • Ask price line — the color of the Ask price line;
  • Last price line — the color of the price line of the latest executed trade;
  • Stop levels — the color of stop order (Stop Loss and Take Profit) levels.
Odoo • Text and Image
Odoo • Image and Text

Price Charts and Technical Analysis

The essence of technical analysis is studying price charts  of financial instruments using technical indicators and analytical objects. Charts in the platform have a variety of settings, so that traders can customize them and adapt to their personal needs. Every chart can display 21 timeframes from one minute (M1) to one month (MN1)

How to Change the Color of the Chart

The chart appearance is highly customizable: you can hide or show any element, as well as change its color. For convenience, three color schemes of charts are available in the platform. In the chart properties , you can select a color scheme or set up colors of individual elements of the chart

Odoo • Text and Image
Odoo • Image and Text

How to Arrange Charts

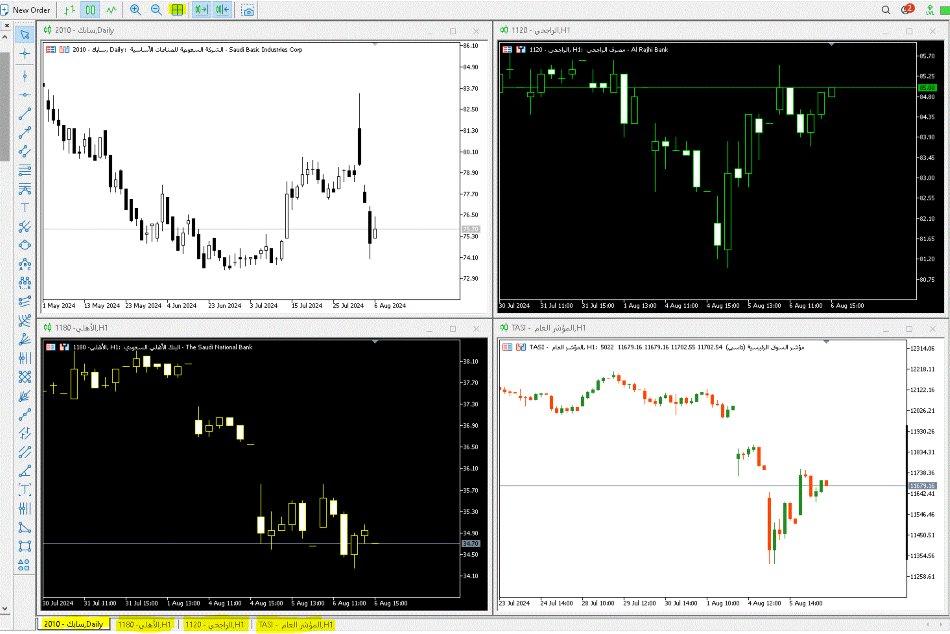
If multiple charts are open in your trading platform, you can easily organize them. Use the window menu and select one of the available chart arrangement types


What are the Templates and Profiles

Templates and profiles allow saving settings of charts and easily apply them when necessary. For example, to analyze a currency pair you have added horizontal lines to mark up the levels. Save a separate chart template in order to preserve the levels. In this case, you can always restore the levels on a new chart by applying the template.

Templates are used for saving parameters of an individual chart:  chart type and color, color scheme, scale, running Expert Advisors, applied indicators and analytical objects, as well as other settings.

In profiles you can save the settings and arrangement of all open charts, that is of the entire workspace for technical analysis.

You can conveniently work with profiles and templates using the toolbar

Odoo • Text and Image
Odoo • Image and Text

Working with Charts on Multiple Monitors

The trading platform allows detaching financial symbol charts from the main terminal working area. This feature is convenient when using multiple monitors. Thus, you may set the main platform window on one monitor to control your account state, and move your charts to the second screen to observe the market situation. To detach a chart from the terminal, disable the " Docked Docked" option in its context menu. After that move the chart to the desired monitor

How to Make a Screenshot Using Trading Platform Tools

To take a screenshot of a chart, click " Save As Picture  Save As Picture" in its context menu
The following options are available:

  • Active workspace — save the entire window of the trading platform.
  • Active chart (as is) — save the active chart with its current size.
  • Active chart — save the active chart with the specified size (in pixels).
  • Post image online in MQL5 Charts service and get the link — if this option is disabled, the chart is saved on a user's PC. A click on OK opens the standard file saving window. If this option is enabled, the chart is saved online in the MQL5 Charts service. In the empty field below you can add a comment for the chart you want to publish.
Odoo • Text and Image

Chart Managing Using the Context Menu and the "Chart" Menu

Commands in these menus are identical (except for "Save As Picture" and "Delete Indicators Window" that are available only in the context menu) and allow to manage chart settings:

  • Trading — open the menu of trading operations for the symbol of the chart: placing stop levels or pending orders.
  • Depth of Market  Depth Of Market — open the Depth of Market of the current chart's symbol.
  • List of indicators  Indicator List — open the "Indicator List" window for managing indicators running on the chart.
  • Objects — open the objects control submenu:
  • List of objects  Object List — open the "Object List" to manage objects on the chart.
  • Delete Last — delete the last added object.
  • Delete All Selected  Delete All Selected — delete all selected objects.
  • Delete All Arrows  Delete All Arrows — delete all arrows belonging to the Arrows group.
  • Delete All — delete all objects from the current chart;
  • Unselect All — unselect all objects on the chart.
  • Unselect — unselect the selected object.
  • Undo Delete  Undo Delete — restore the last deleted object.
  • List of Expert Advisors  Expert List — open the "Expert List" window to manage Expert Advisors running on the chart.
  • Bar chart  Bar chart — show the chart as a sequence of bars.
  • Candlesticks  Candlestick — show the chart as a sequence of Japanese candlesticks.
  • Line Chart  Line — show the chart as a broken line that connects close prices of bars.
  • Timeframes — select the chart timeframe. A click on this item opens a sub menu, where you can select one of the available timeframes.
  • Templates — managing chart templates.
  • Refresh  Refresh — refresh the chart window. When you refresh the chart, the price data displayed on it are also recalculated based on one-minute data stored on the computer.
  • Docked  Docked — dock/undock the chart window from the main platform window.
  • Toolbar — show/hide the toolbar in the chart window. The command is only available for the charts, which were detached from the main platform window.
  • Grid  Grid — show/hide grid on the chart.
  • Auto Scroll  Auto Scroll — enable/disable automatic chart scrolling to its beginning when new ticks are received.
  • Chart Shift  Chart Shift — enable/disable chart shift from the right side of the window.
  • One Click Trading  One Click Trading — show/hide the one click trading panel on the chart.
  • Volumes  Volumes — show/hide real trade volumes for the charts of exchange instruments.
  • Tick Volumes  Tick Volumes — show/hide tick volumes for the charts of Forex instruments.
  • Zoom In  Zoom In — zoom in the chart.
  • Zoom Out  Zoom Out — zoom out the chart.
  • Delete Indicators Window  Delete Indicator Window — delete the indicator sub window. This command is only available in the context menu when called from the sub window, in which the indicator is opened.
  • Step by Step  Step by Step — move the chart bar by bar from right to left. This function is only available when the autoscroll feature is disabled.
  • Save As Picture  Save As Picture — save the chart as a picture in a *.png file. This command also allows to immediately publish a screenshot of the chart online using a special service of the MQL5.community site and share it with other traders. See "Publishing Charts Online" for details.
  • Properties  Properties — open the chart properties managing window.

Chart Managing Using a Mouse

A chart can be managed using a mouse:

  • click-and-hold anywhere in the chart window and then move the cursor horizontally to scroll the chart;
  • click-and-hold on the vertical scale of the chart and move the cursor vertically to change the vertical scale of the chart; double-click on the vertical scale of the chart to restore the chart scale;
  • click-and-hold on the horizontal chart scale (anywhere outside the fast navigation bar) and move the cursor horizontally to change the chart scale;
  • right-click anywhere in the chart window to open the context menu of the chart (see below);
  • double-click on the elements of technical indicators (lines, signs, histogram bars, etc.) to call the indicator setup window;
  • right-click on elements of a technical indicator to call the context menu of the indicator;
  • depending on the platform settings, a single or a double click on an object (line studies, text or arrow) selects the object;
  • click-and-hold the selected object and drag to move it;
  • Ctrl + left-clicking on a selected trend line and then moving the cursor allows to draw a parallel trend line (create a channel);
  • hold down Ctrl and scroll the mouse wheel to scale the chart;
  • click with the mouse wheel on a chart tab in the switch panel closes the chart;
  • middle-click on the chart window to switch the cursor to the "crosshair" mode;
  • right-click on a selected object to open its context menu;
  • point your mouse to the Close price of a bar or to an element of an object or indicator to call a prompt.

Chart Managing from Keyboard

Various chart manipulations can be performed using certain keys and key combinations:

  • Home — move the chart to the last bar;
  • End — move the chart to the first bar;
  • Page Up — move the chart at a one-window distance back;
  • Page Down — move the chart at a one-window distance forward;
  • Ctrl+I — open the window containing the list of indicators;
  • Ctrl+B — open the window containing the list of objects;
  • Alt+1 — show the chart as a sequence of bars;
  • Alt+2 — show the chart as a sequence of Japanese candlesticks;
  • Alt+3 — show the chart as a broken line that connects the Close prices of bars;
  • Ctrl+G — show/hide grid in the chart window;
  • "+" — zoom in the chart;
  • "-" — zoom out the chart;
  • F12 — scroll the chart step by step (bar by bar);
  • F8 — open the properties window;
  • Backspace — delete the last added object from the chart;
  • Delete — delete all selected objects;
  • Ctrl+Z — cancel deletion of the last object.

Fixed Chart Position

Every chart has an icon  — a gray triangle located in the bottom left corner of the window by default. Move the triangle on any bar to lock its position on the chart:


Odoo • A picture with a caption

The selected bar stays in this position when you zoom the chart.
The position stays fixed until you change the chart timeframe.