Candlestick patterns
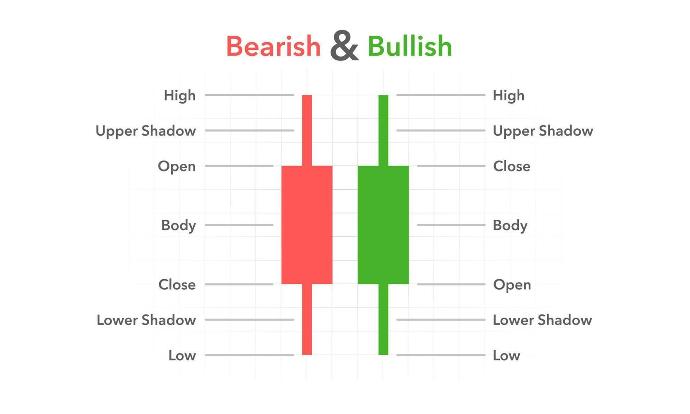
Candlesticks are technical analysis tools used in financial markets to provide information about price movements and market trends. Each candlestick on the chart represents a specific time period (such as a minute, hour, or day) and contains information about the opening price, closing price, highest price, and lowest price during that period. A candlestick consists of a body (the difference between the opening and closing prices) and shadows (the highest and lowest prices)
Candlestick patterns vary and differ based on the conditions in which they are used. Generally, there are many patterns that traders and analysts use. These patterns can be classified into two main types: single candlestick patterns and multiple candlestick patterns. The number of distinct candlestick patterns ranges from 20 to 30. Here are some common patterns:
(Bullish Engulfing)
It occurs when a small bearish candlestick is followed by a large bullish candlestick that completely covers it. This indicates a potential bullish reversal, and the opposite is true for bearish reversals
(Bearish Engulfing)
It occurs when a small bullish candlestick is followed by a large bearish candlestick that completely covers it. This indicates a potential bearish reversal, and the opposite is true for bullish reversals
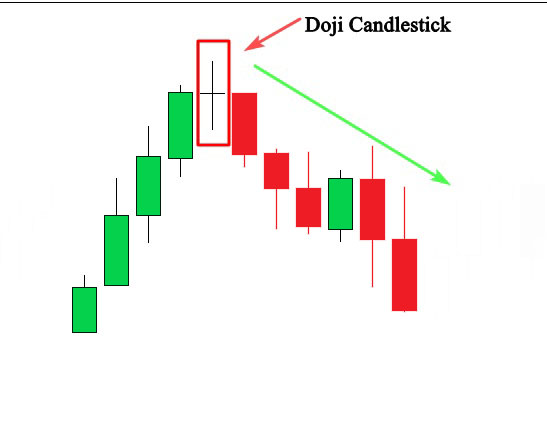
(Doji)
This appears when the opening and closing prices are nearly equal, indicating market indecision and uncertainty
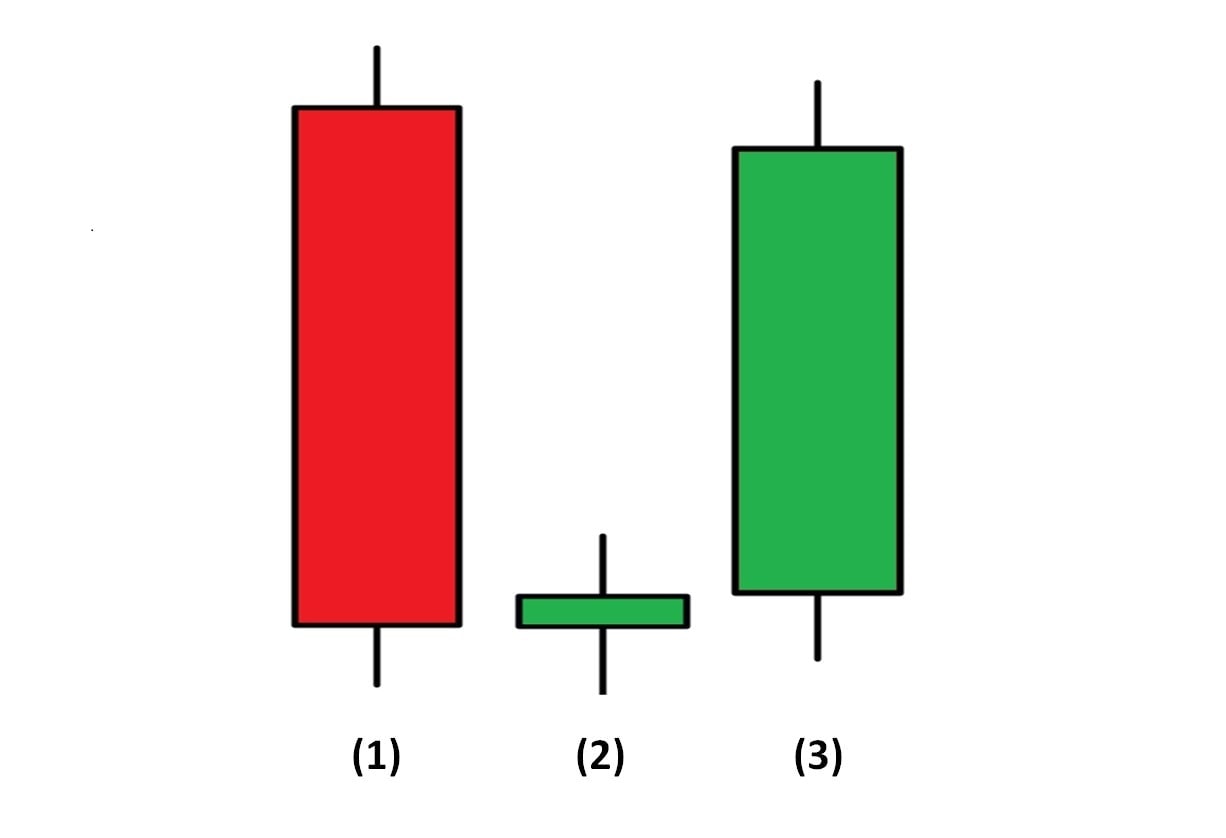
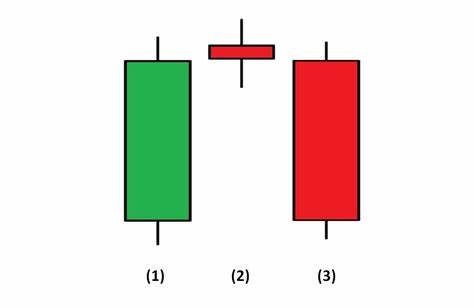
(Morning Star)
A pattern consisting of three candlesticks that indicates a potential bullish reversal: a large bearish candlestick, followed by a small candlestick (the star), and then a large bullish candlestick
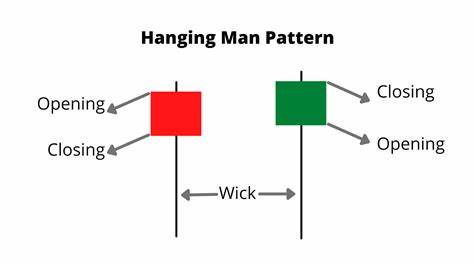
(Hanging Man)
Also known as the Hanging Man, it appears at the end of an uptrend, with a small body at the top and long shadows extending downward. It may indicate a potential bearish reversal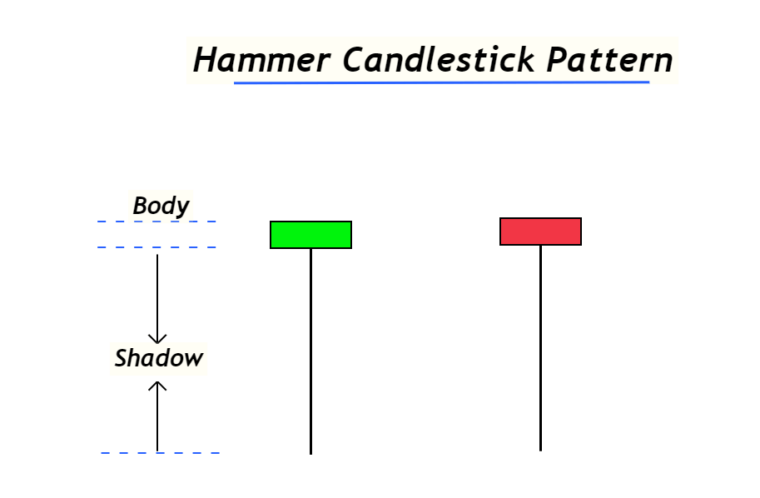
(Bullish Hammer)
It appears at the end of a downtrend, with a small body at the top and long shadows extending downward. It indicates a potential bullish reversal
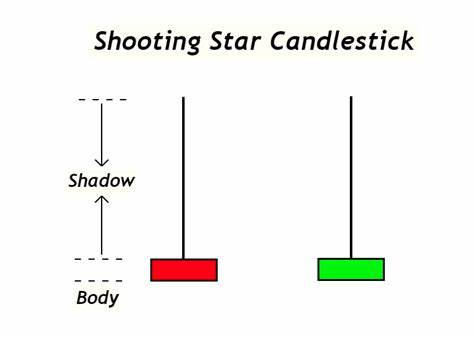
(Shooting Star)
It appears at the end of an uptrend, with a small body at the bottom and long shadows extending upward. It indicates a potential bearish reversal
(Evening Star)
A pattern consisting of three candlesticks indicating a potential bullish reversal: a large bearish candlestick, followed by a small candlestick (the star), and then a large bullish candlestick.
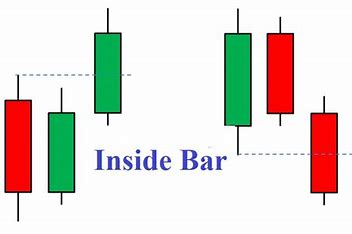
(Inside Bar)
It consists of a small candlestick contained within the body of a larger candlestick, indicating a potential reversal or correction in the market
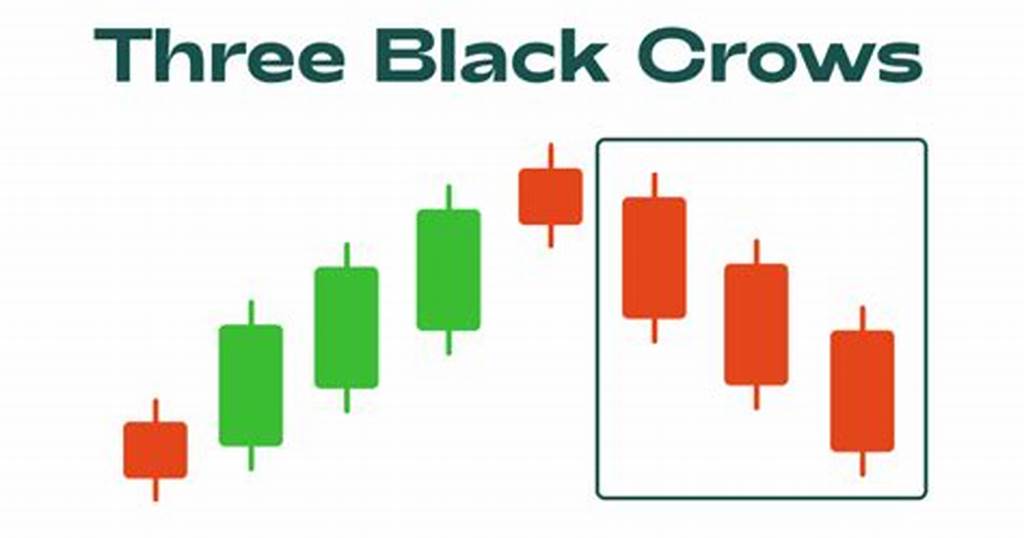
(Three Black Crows)
It consists of three consecutive bearish candlesticks, each lower than the previous one, indicating the strength of the bearish trend
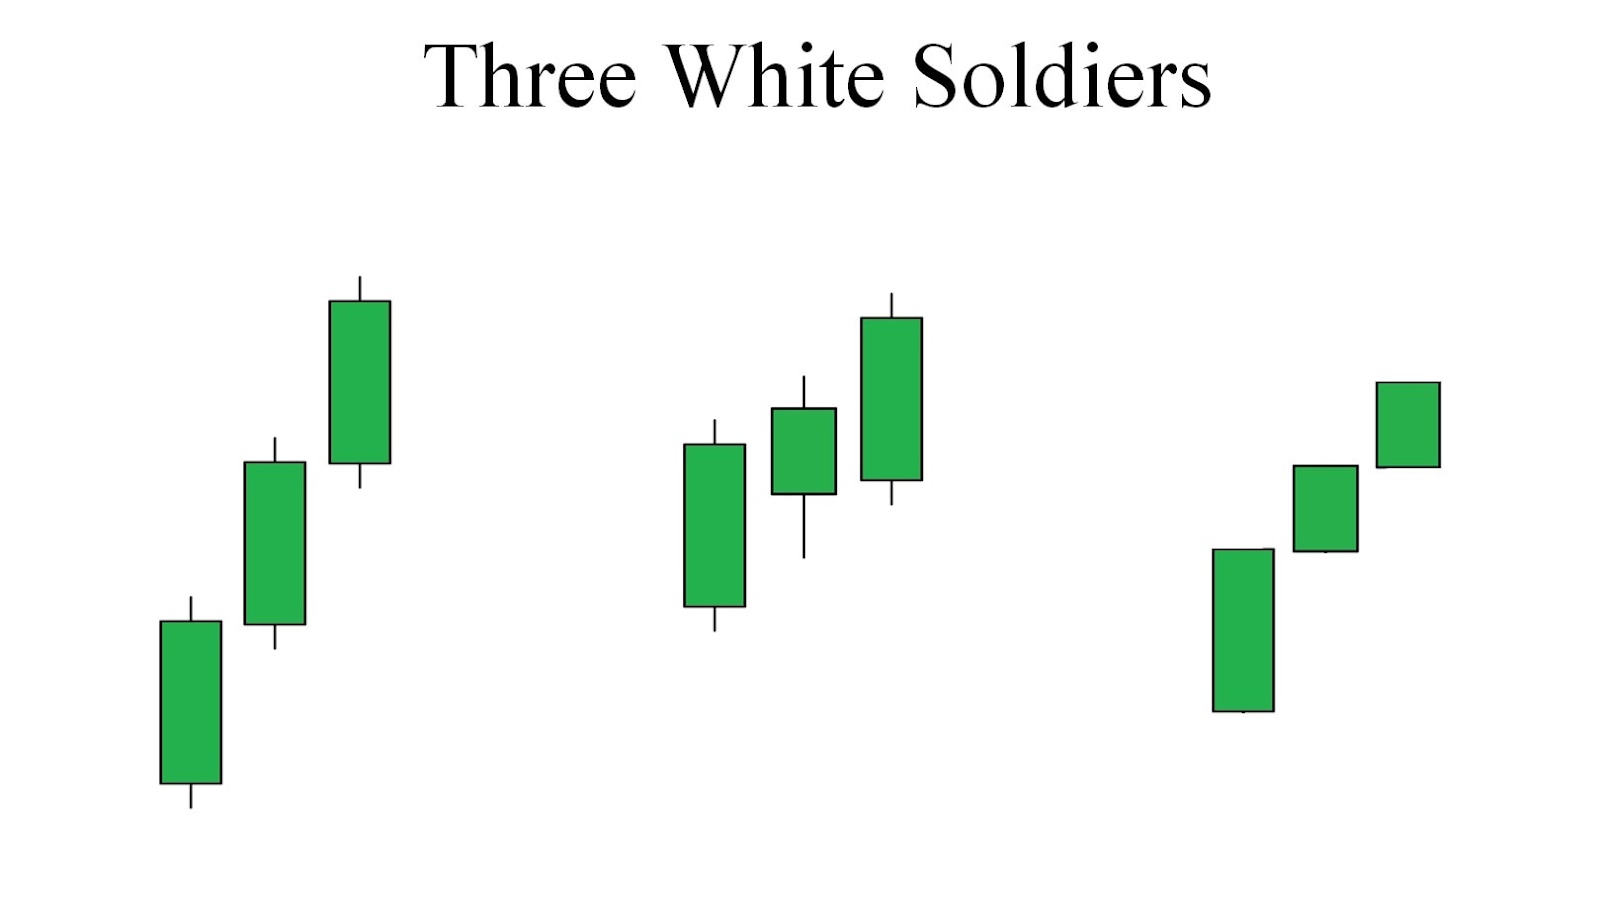
(Three White Soldiers)
Also known as the Three Soldiers, it consists of three consecutive bullish candlesticks, each higher than the previous one, indicating the strength of the bullish trend
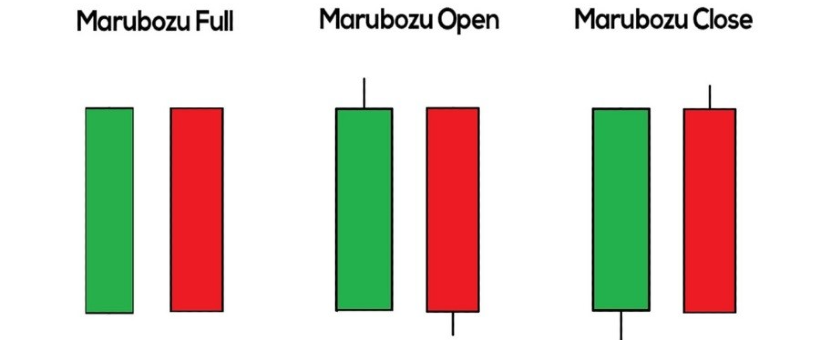
(Marubozu)
It indicates that buyers or sellers were in control throughout the candlestick's duration. This candlestick is interpreted as a strong signal of trend continuation or strong buying and selling pressure