مفاتيح هامة لبرنامج MT5
ستجد في القائمة الرئيسية للموقع الاكتروني خانة "تسجيل الدخول" يرجى الضغط عليها ثم اختيار "لا تملك حساب" واكمل تسجيل بياناتك بشكل صحيح
بعد التسجيل سيتم انشاء حساب تجريبي لك على برنامج MT5 وستجد تفاصيل هذا الحساب موجودة داخل صفحة "حسابي"
تفاصيل حسابك التجريبي في برنامج MT5 في صفحة حسابي :
بعد ذلك اختر من قائمة البرامج مايناسب نظام التشغيل لجهاز الكمبيوتر الخاص بك (ويندوز - ماك), ولمعرفة كيفية اضافة البيانات اعلاه لدى برنامج MT5 يرجى اختيار الخيار التالي في اعلى هذه الصفحة لطريقة تسجيل الدخول في برنامج MT5
لتسجيل الدخول في برنامج MT5 للكمبيوتر :
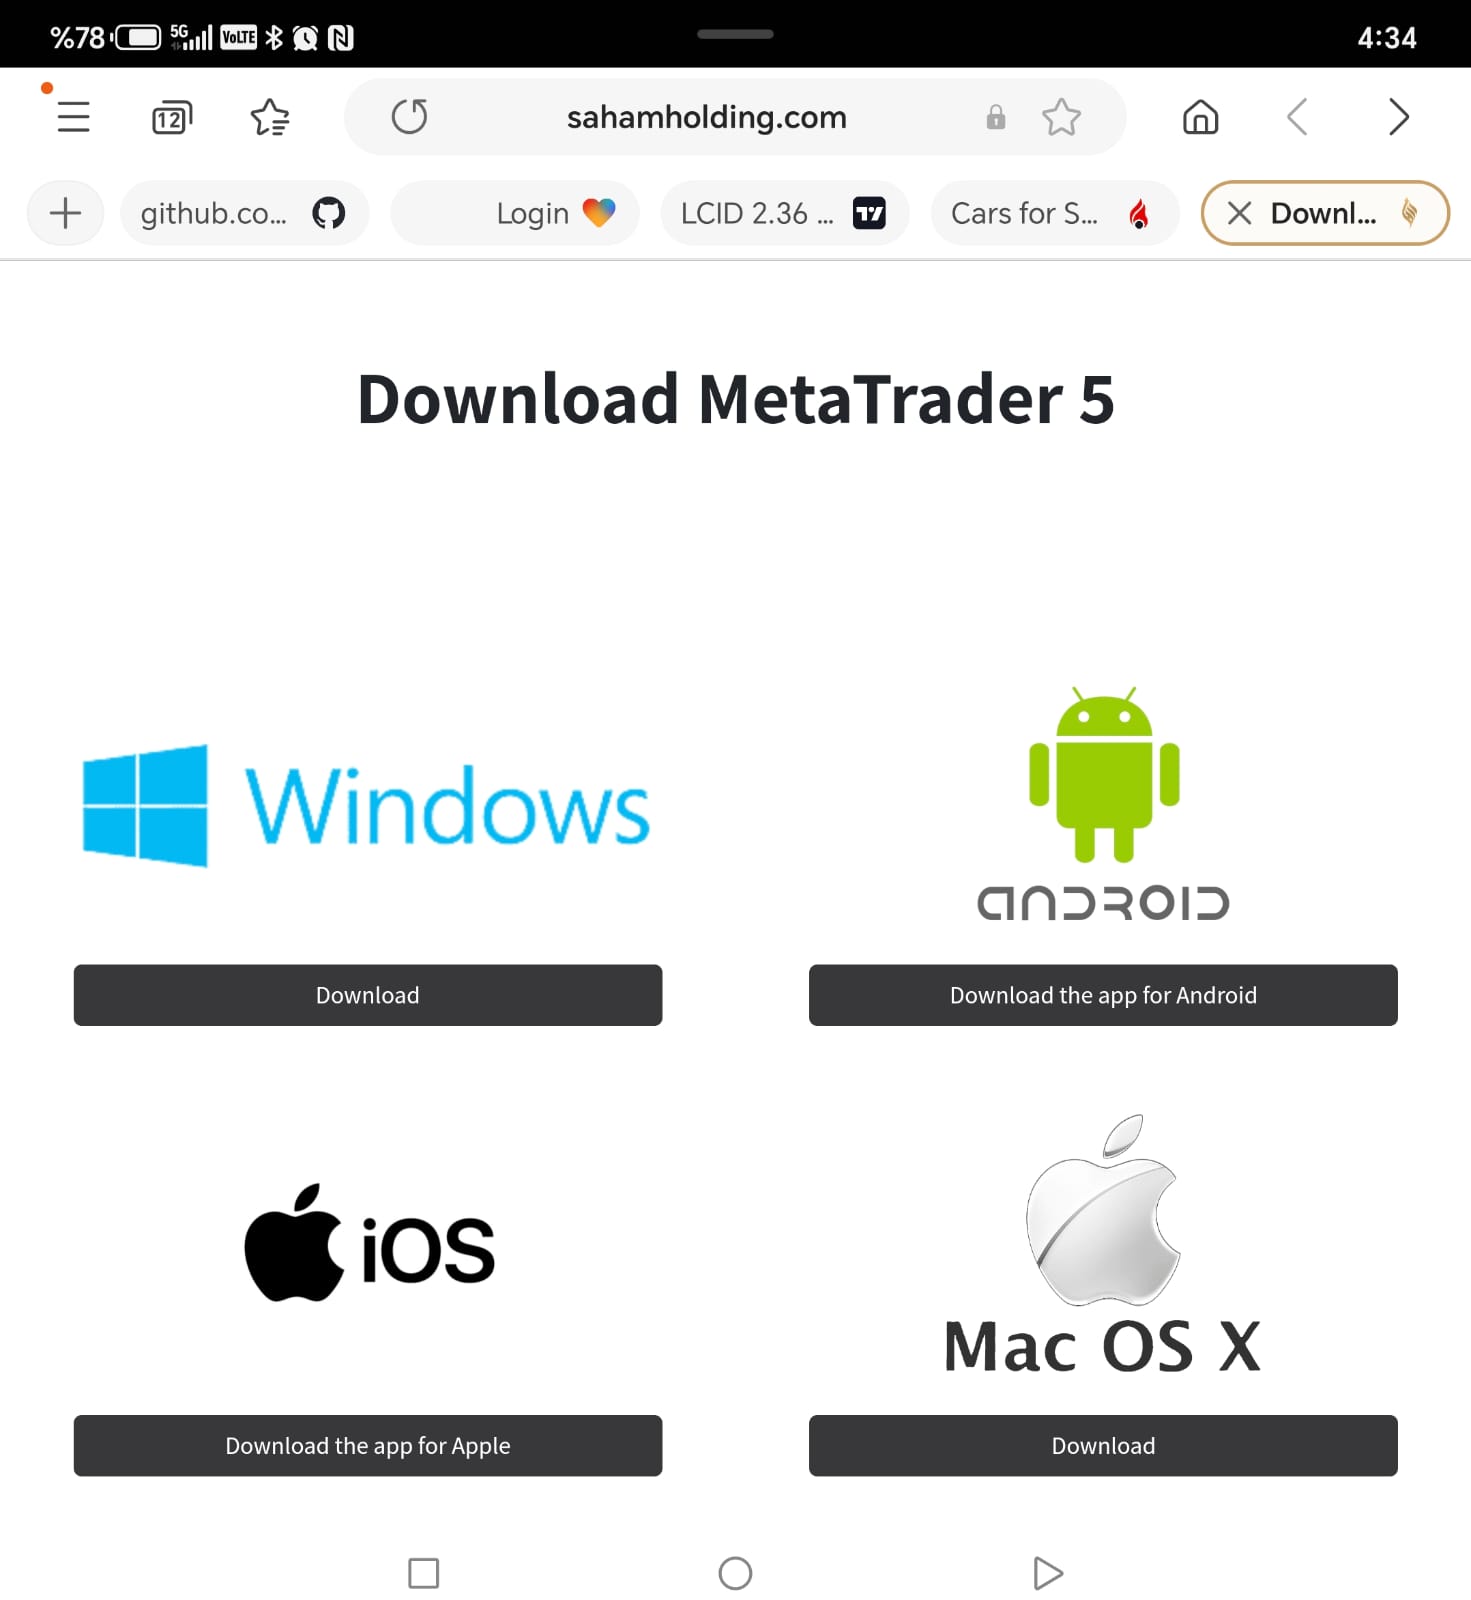
1- حمل التطبيق من صفحة تحميل البرامج.
توجه الى القائمة الرئيسية بالبرنامج ثم اختر ملف >> تسجيل الدخول الى حساب تداول >> ثم ادخل رقم تسجيل الدخول وكلمة السر >> موافق او OK
* يرجى ملاحظة ان اسم الخادم : Saham-Server يرجى عدم تغييره والا لن تتمكن من مشاهدة السوق السعودي
لتسجيل الدخول الى برنامج MT5 من تطبيق الهاتف :
1- حمل التطبيق من صفحة تحميل البرامج.
2-بعد تحميل البرنامج - افتح التطبيق وستظهر لك الصورة التالية :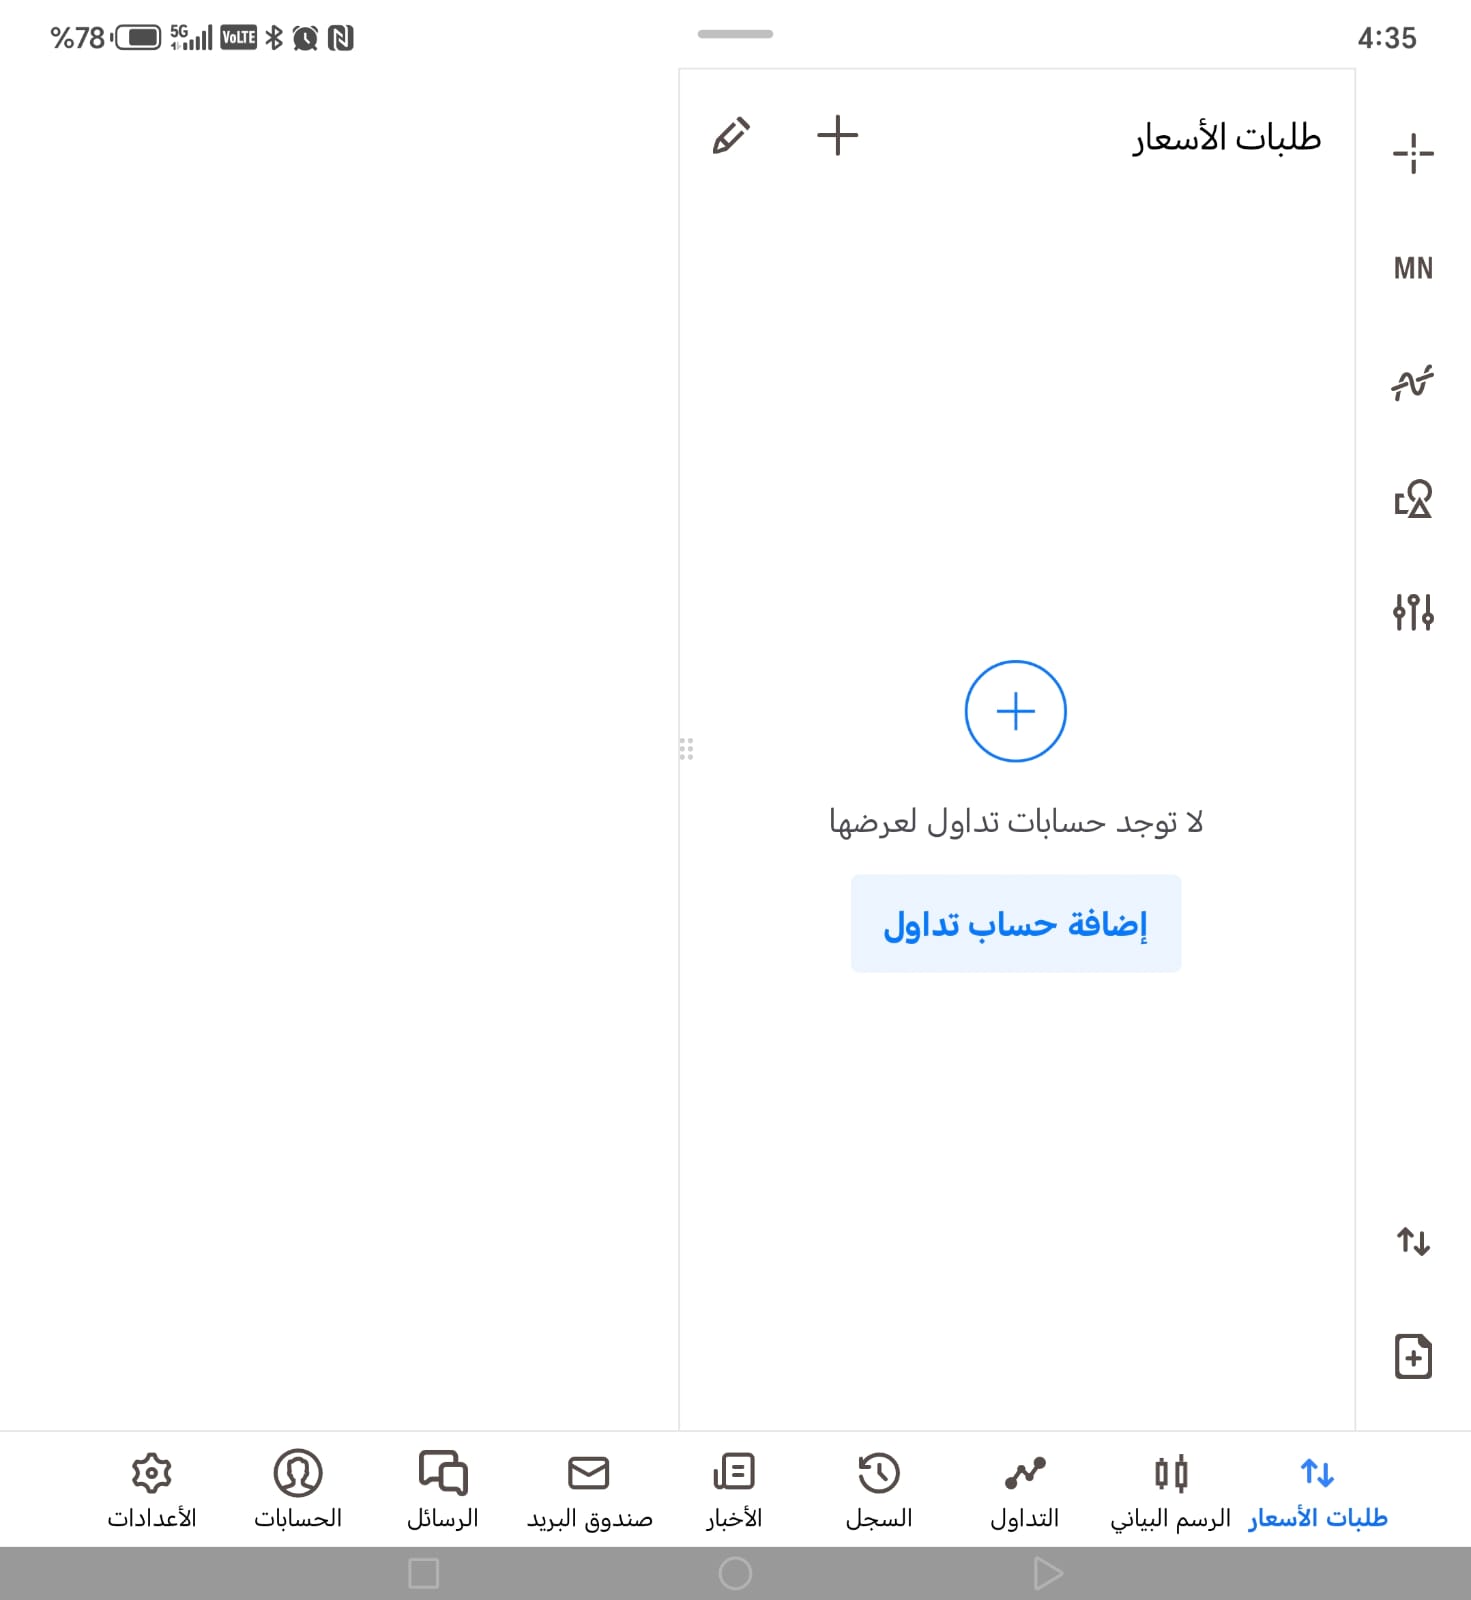
اضغط على كلمة اضافة حساب تداول ثم اختر الوسيط Saham Holding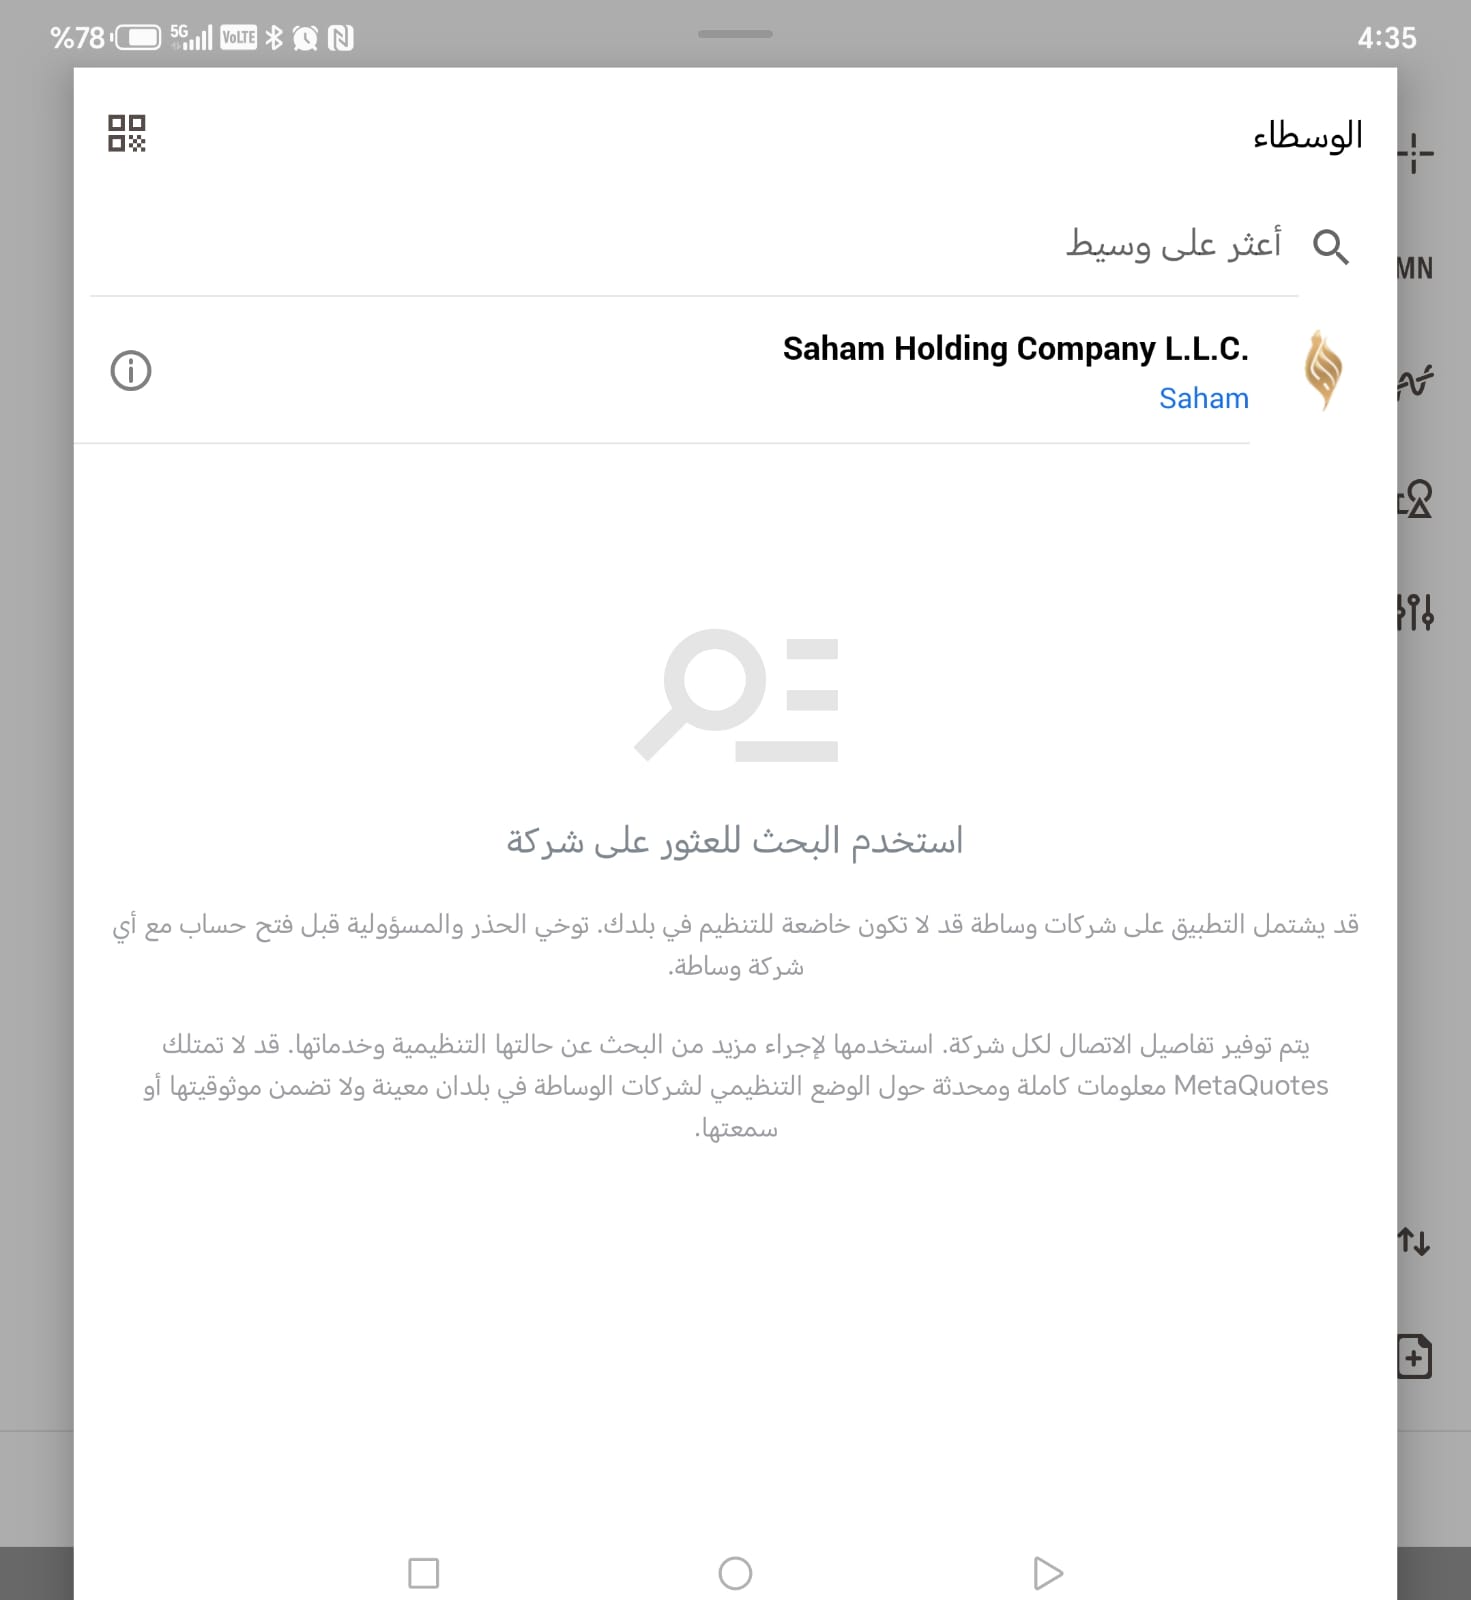
ادخل البيانات التالية :
1- بيانات تسجيل الدخول والرقم السري لبرنامج MT5 الموجودة في صفحة حسابي بالموقع الالكتروني
2- انقل تلك البيانات الى تطبيق الهاتف (تسيجل الدخول والرقم السري):
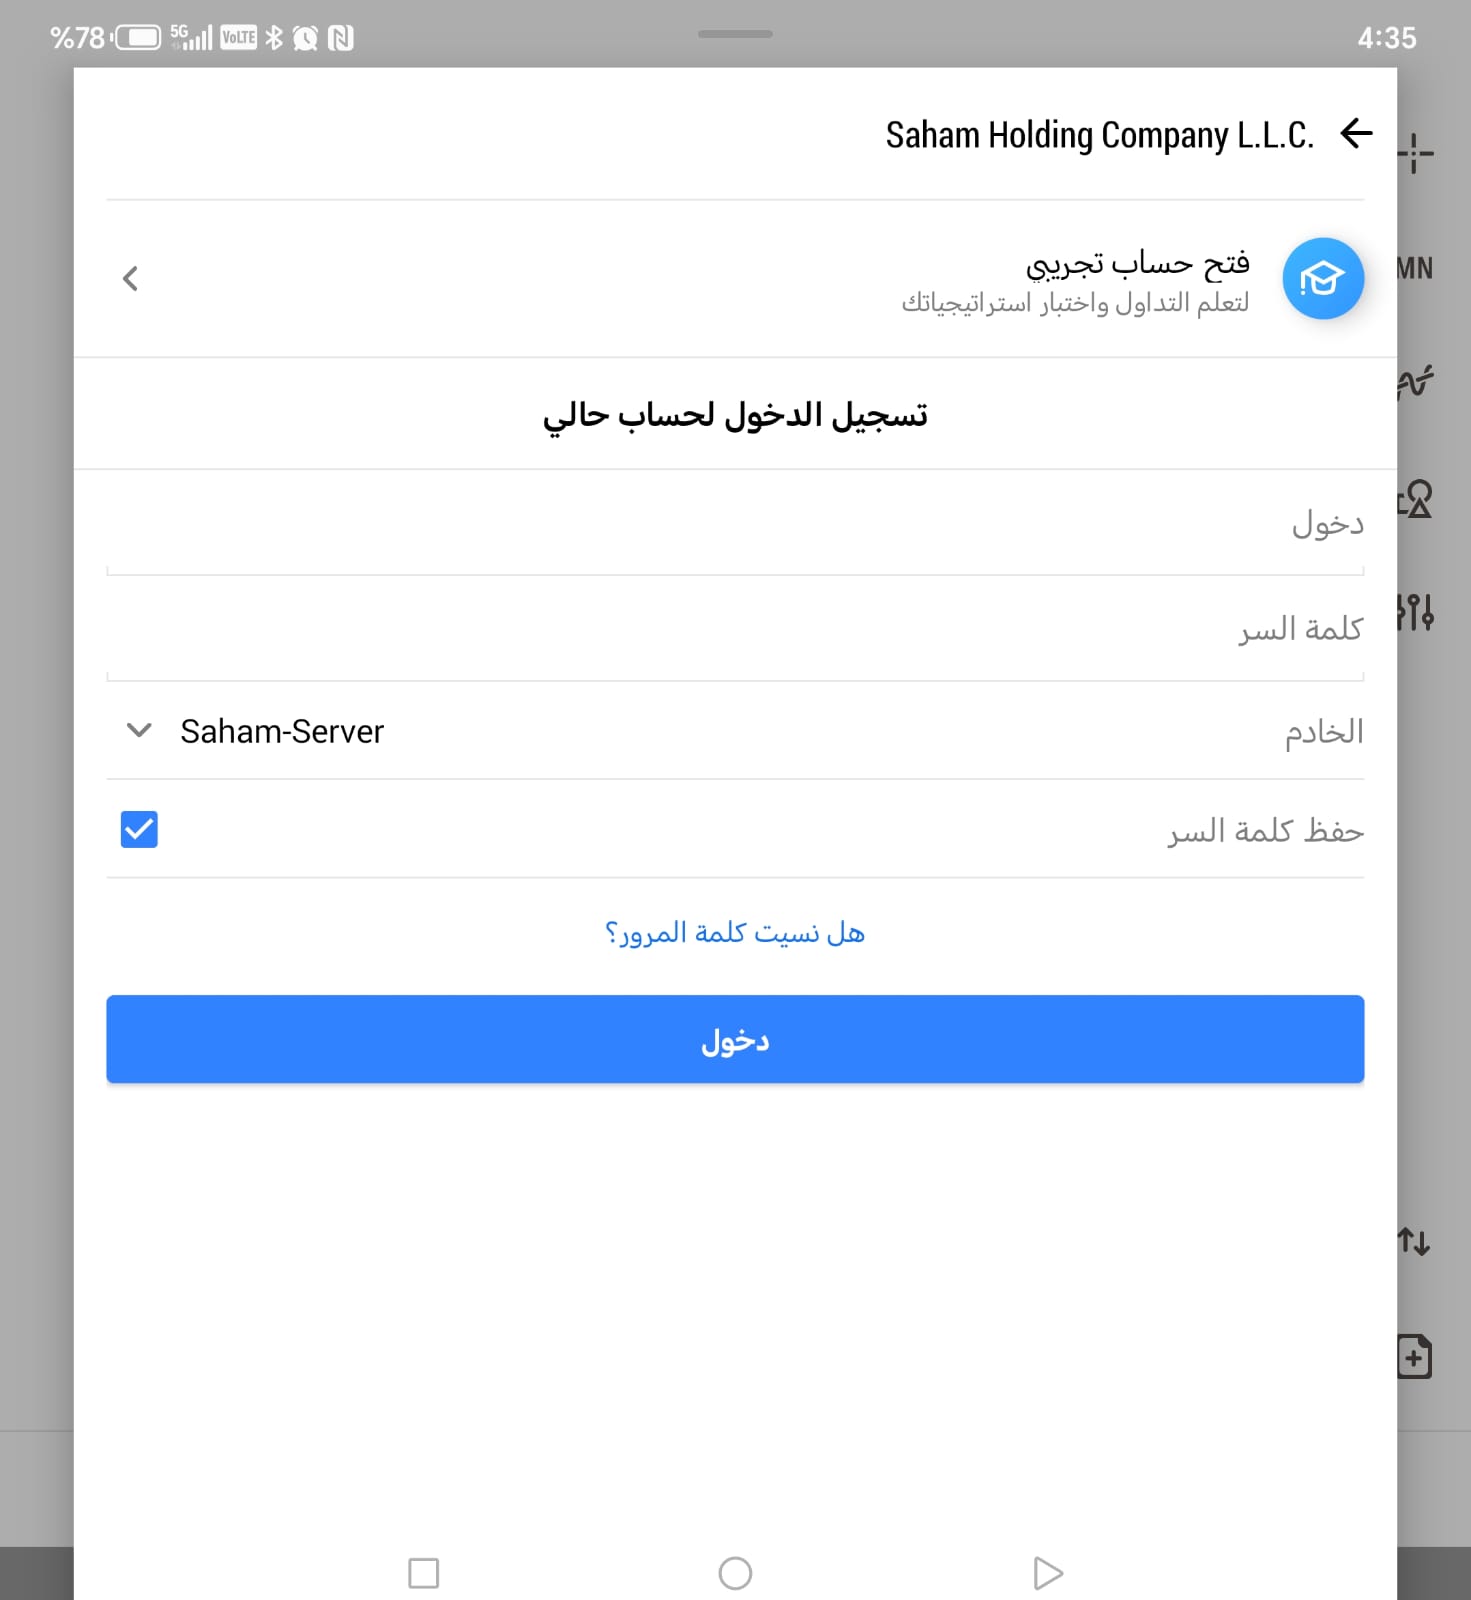
سيعمل معك التطبيق الان بشكل مباشر :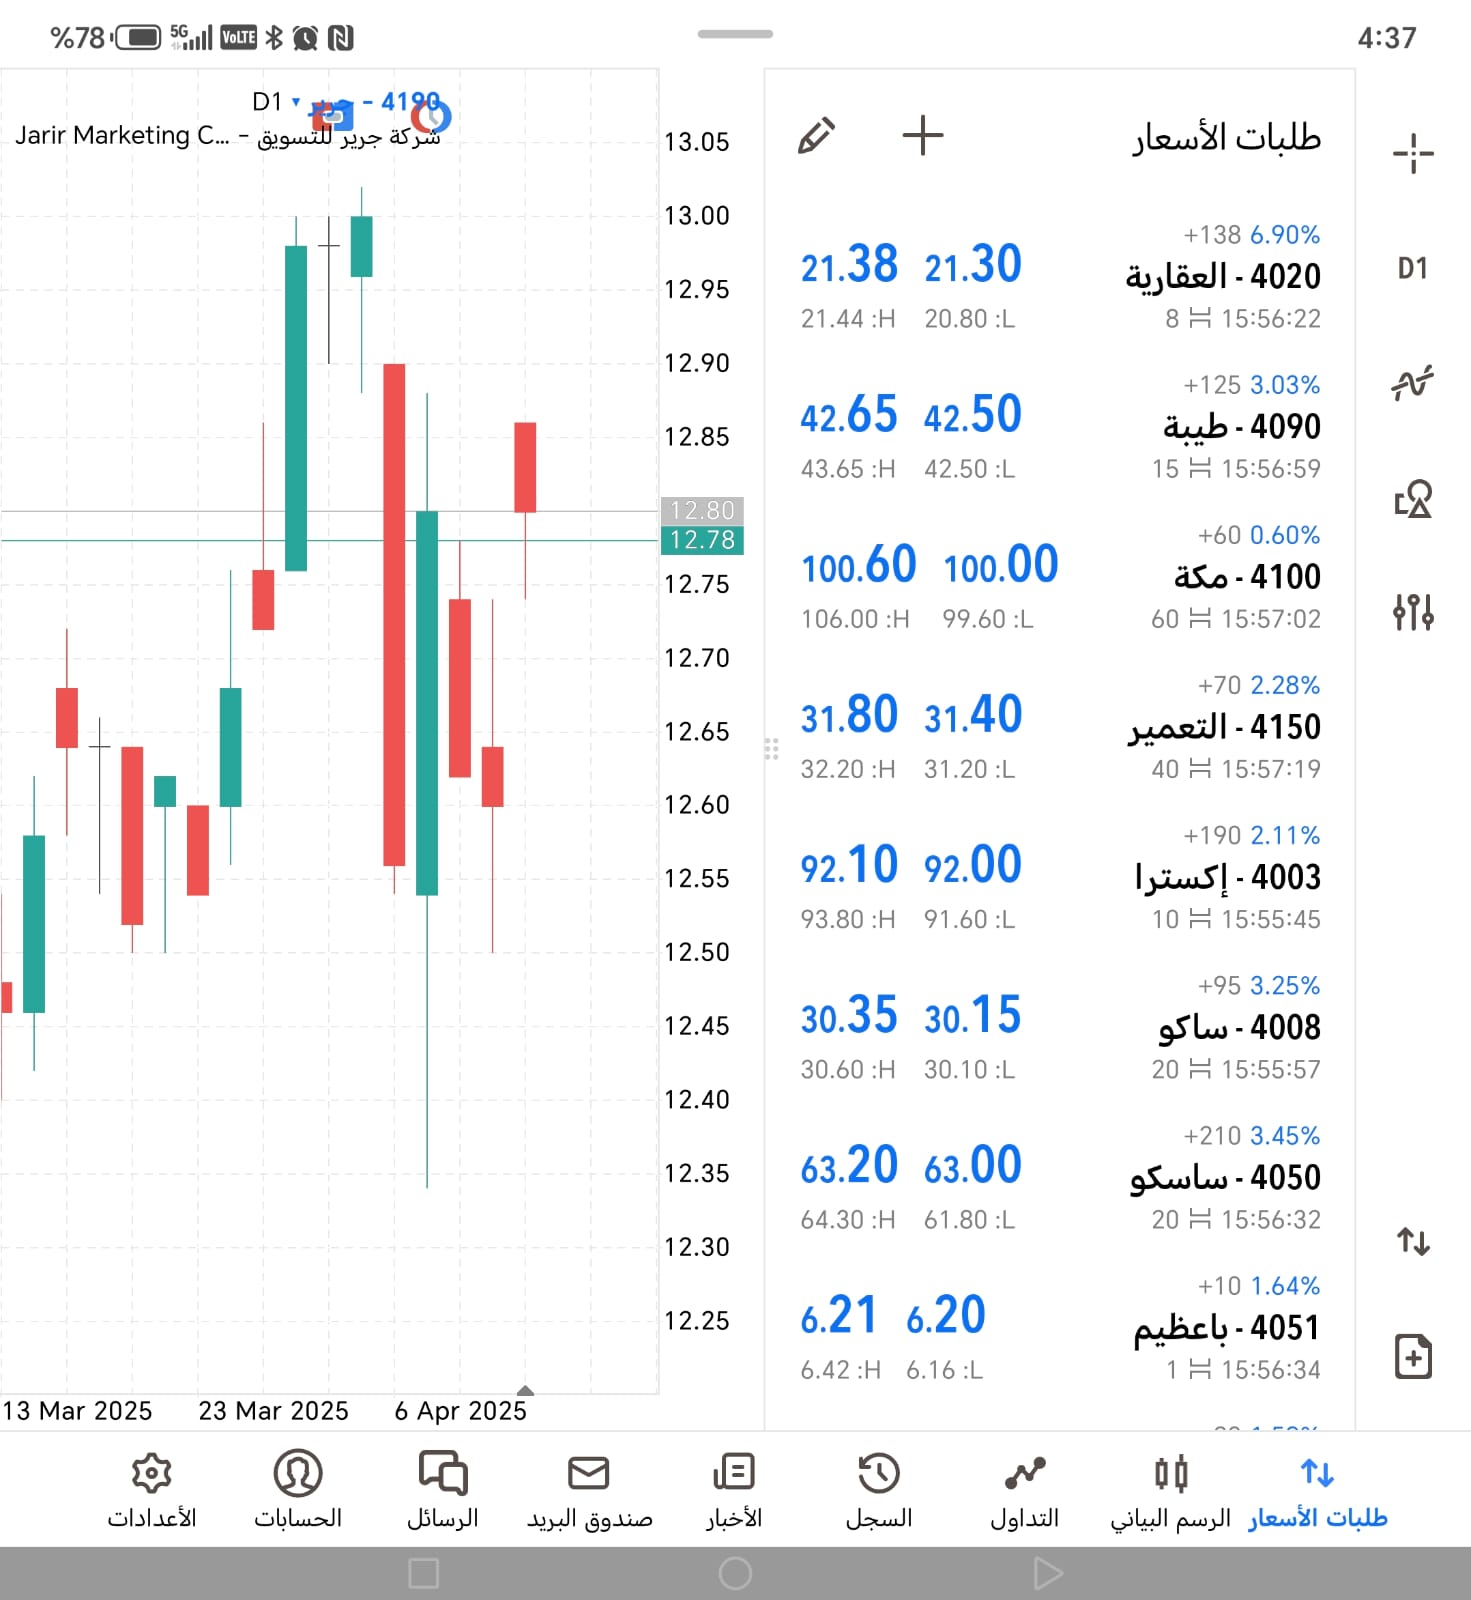
بالامكان تغيير الرقم السري من خلال صفحة حسابي بالضغط على كلمة "تغيير الرقم السري لبرنامج MT5"
او من خلال برنامج MT5 >> من القائمة الرئيسية اختر "ادوات" >> ثم اختر "خيارات" >> ثم اختر "تغيير" التي بجانب كلمة السر >> ادخل كلمة السر القدمية ثم كلمة السر الجديدة مرتين ثم اضغط على كلمة "تم"
ضع الماوس "الفارة" اليمين على الرسم البياني >> اضغط الزر الايمين من الفارة >> اختر خصائص >> قم بتعديل الرسم البياني كما ترغب وستظهر نتائج التعديل في نفس المربع قبل عتمادها من قبلك
هناك اكثر من طريقة للوصول الى شاشة اختيار الاسواق :
الطريقة الالولى: وهي الاسهل, من الشاشة الرئيسية لبرنامج MT5 اضغط على علامة الرموز  لفتح شاشة قائمة الاسواق, ثم اتبع الخطوات الموجودة بالنقطة الاولى.
الطريقة الثانية: لاختيار احد الاسواق او جمبيعها, اختر من القائمة الرئيسية "عرض" ثم اختر "الرموز". ستظهر لك شاشة على يمينها قائمة الاسواق وعلى يسارها قائمة اسهم تلك الاسواق, اختر مايناسبك منها ثم اضغط على كلمة "اظهار الرمز" ثم موافق
الطريقة الثالثة: من قائمة مراقبة السوق, اضغط زر الفارة الايمين واختار كلمة الرموز واتبع نفس الخطوات الموجود بالنقطة الاولى.
الطريقة الرابعة: الضغط على زر (Ctrl + U) لفتح شاشة قائمة الاسواق, ثم اتبع الخطوات الموجودة بالنقطة الاولى.
ستجد علامة شبكة ( ) تقسيم الرسم البياني في قائمة الخيارات الموجودة اعلى الرسم البياني, قم بالضغط عليها ليتم تقسيم الرسم البياني بناء على عدد الشركات الموجودة اسفل الرسم البياني
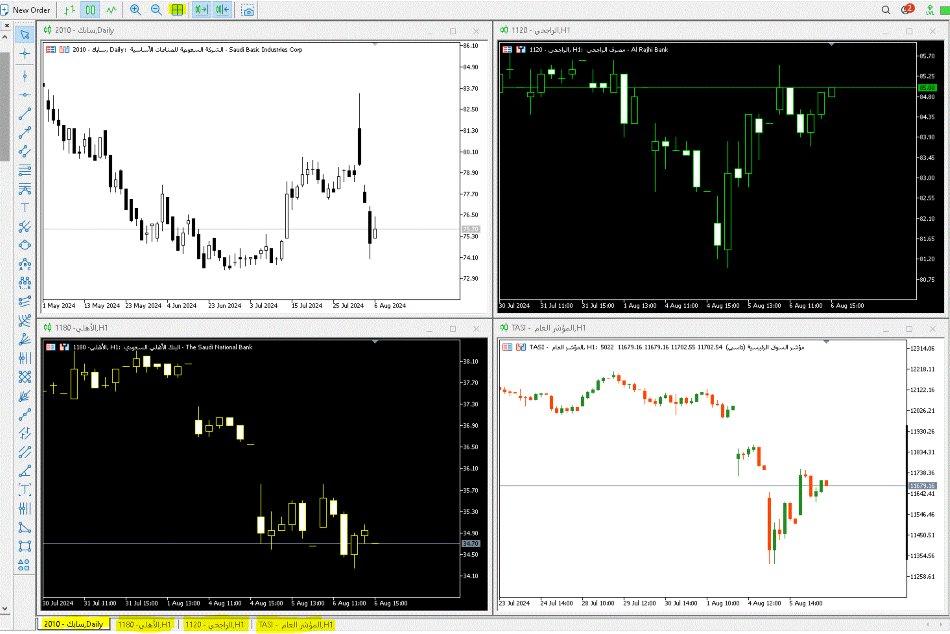
ستجد في اسفل قائمة مراقبة السوق خيار اضافة, اكتب اسم السهم او رقمة وسيظهر لديك.
او بالامكان ان تضع المؤشر على اي سهم ومن ثم اكتب رقم السهم وسيظهر لك.
ضع الماوس "الفارة" اليمين على الرسم البياني >> اضغط الزر الايمين من الفارة >> اختر خصائص >> قم بتعديل الرسم البياني كما ترغب وستظهر نتائج التعديل في نفس المربع قبل عتمادها من قبلك
لاضافة سوق بالامكان الضغط على (Ctrl + حرف U) من لوحة المفاتيح لديك او من القائمة الرئيسية في برنامج MT5 اختار كلمة "عرض" القائمة الرئيسية >> ثم اختر "الرموز"
ستظهر لك قائمة تحتوي على الاسواق بالجهة اليسار وقائمة اسهم تلك الاسواق بالجهة اليمين
اختر او الغي مايناسبك منها ثم اختار من الاسفل كلمة اظهار الرمز او اخفاء الرمز >> وبعد الانتهاء من اختيار الاسواق التي تريدها اضغط على كلمة موافق
في شاشة مراقبة السوق, ستجد بالاسفل خيار لإضافة سهم , ادخل اسم السهم او رقم السهم وسيظهر لك 
ضع الماوس "الفارة" اليمين على الرسم البياني >> اضغط الزر الايمين من الفارة >> اختر خصائص >> قم بتعديل الرسم البياني كما ترغب وستظهر نتائج التعديل في نفس المربع قبل عتمادها من قبلك