|
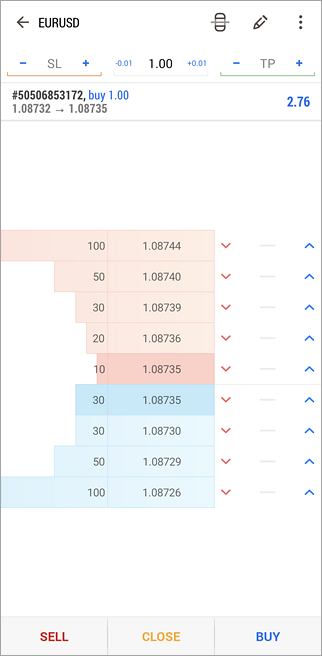
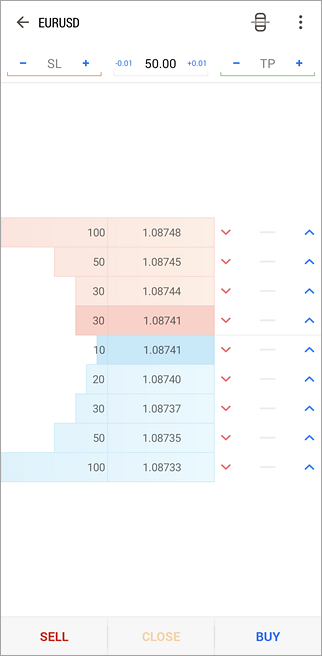
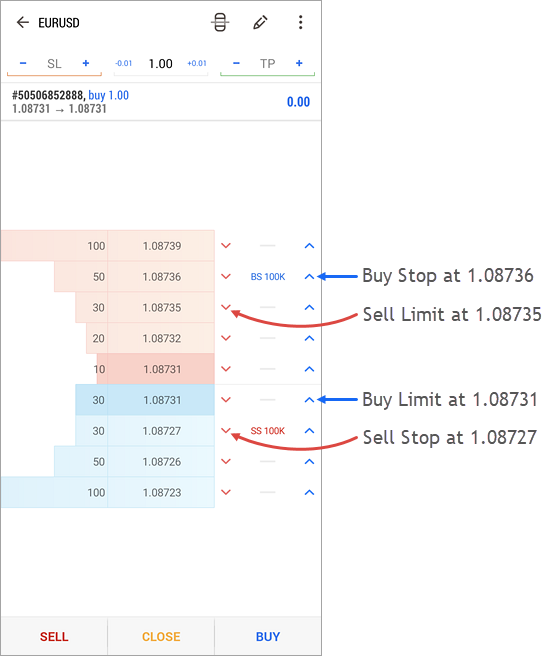
Market order commands are located below:
-
Sell – make a Sell deal in the size specified in "vol" field at the best available price.
-
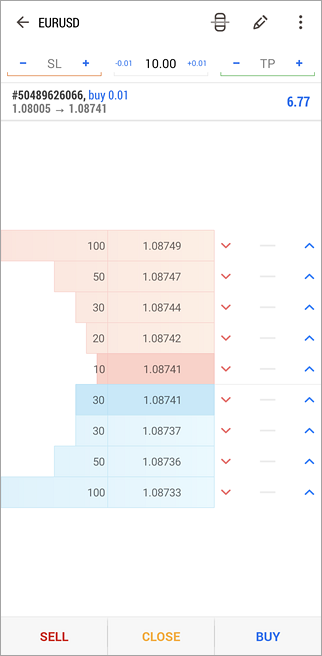
Close – this button is enabled only if there is an open position for a selected financial instrument. It allows you to close the entire position at the best available price.
-
Buy – make a Buy deal in the size specified in "vol" field at the best available price.
|
|
Chart
A chart shows price changes over time. To switch to this tab, use the side or the bottom panel of the MetaTrader 5.
Chart Opening
In order to open a chart of a financial instrument, run the "Chart" menu command in the "Quotes" tab.
Chart period
In the MetaTrader 5 for Android, you can view 9 chart timeframes: from 1 minute (M1) to a month one (MN). Use the radial menu in order to switch between the timeframes.
|

|
Trade
To start trading the financial instrument of the current chart, tap  on the upper panel. on the upper panel.
|
There is a limit to the depth of price data that can be displayed in the mobile version of the MetaTrader 5 for Android. The depth of the data depends on the device performance, but it cannot exceed 1500 bars. As soon as the limit has been reached, the "Maximum bars limit" notice appears at the bottom of the chart.
|
Chart Management
A user can perform the following manipulations on charts:
-
Scrolling
– to scroll through a chart, drag your finger left or right.
-
Scaling
– to zoom in, place two fingers together on the area of the chart you want to zoom in and then drag your fingers apart. To zoom out, place two fingers on different parts of the screen and drag them towards each other.
-
Full-screen mode
– the full-screen mode is automatically enabled when you rotate your device to the landscape mode. Further you can switch between the full screen and normal mode by tapping on the chart.
-
Symbol
– to view a chart of another symbol, tap
 . .
-
Change the chart type
– there are three chart types available. If you want to switch between the chart types, open chart settings from the radial. Select the desired presentation type from the "Line type" option:
-
Bar chart
– show the chart as a sequence of bars.
-
Candlestick
– show the chart as a sequence of Japanese candlesticks.
-
Line chart
– show the chart as a broken line that connects close prices of bars
.
-
Indicators
– to start working with indicators on a chart, tap button
 on the top panel or in the radial menu. on the top panel or in the radial menu.
-
Setting
– in order to access chart settings, open the radial menu and tap
 . .
-
Tile charts
– you can open multiple charts in the mobile platform: up to 4 charts on Android-smartphones, and up to 6 charts on tablets. If you want to customize the arrangement of charts, tap
 on the top panel. on the top panel.
|
|
|
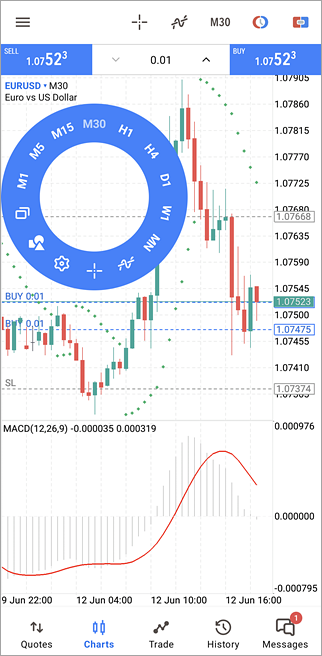
Radial Menu
The radial menu is opened by a tap on the chart. Using the menu you can:
-
Change the timeframe
-
Attach indicators to a chart
-
Apply objects to a chart
-
Enable crosshairs
-
Open chart settings
Each chart is provided with a separate radial menu, which allows accessing the settings of the chart.
|
Crosshair
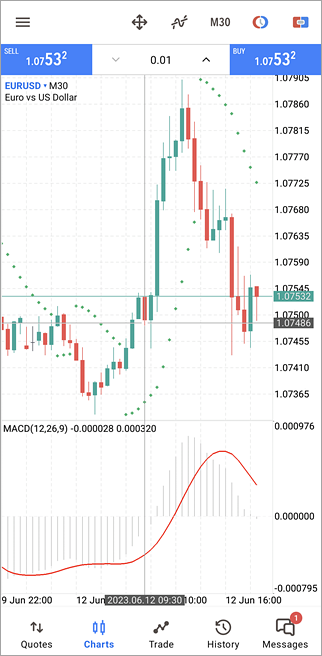
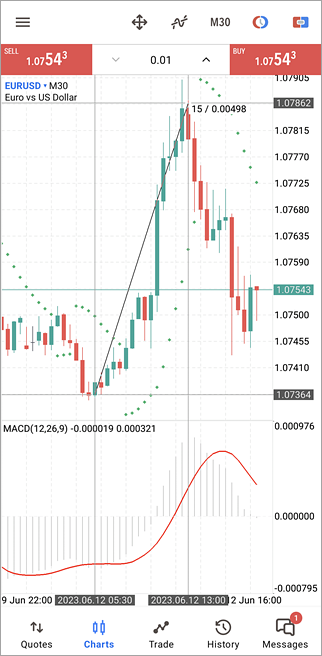
"Crosshair" mode allows viewing an exact date, price and indicator values at any point of a chart. To turn on the mode, tap on  in the top panel of the chart or in the radial menu. Move the crosshair over any point of the chart, the date and price of the point will be appear on the appropriate chart scales. in the top panel of the chart or in the radial menu. Move the crosshair over any point of the chart, the date and price of the point will be appear on the appropriate chart scales.
|
|
|
|
Ruler
In the Crosshair mode you can measure the distance from one point on a chart to another. To do this, set the crosshairs by one finger at the first point, hold it and swiping the screen with another finger to the second point.
The crosshair caption contains two values: the distance along the horizontal axis in bars and the distance along the vertical axis in price terms or indicator values.
|
Data Window
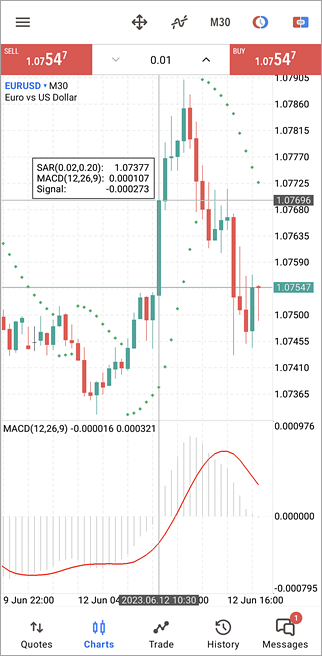
Data Window allows viewing spread values (highest spread for the selected bar) and the indicator values. The Data Window can be enabled in MetaTrader 5 for Android settings. After that switch to the Crosshair mode and move it to the desired point.
|
|
|
|
Resizing a sub window and shifting from the chart edge
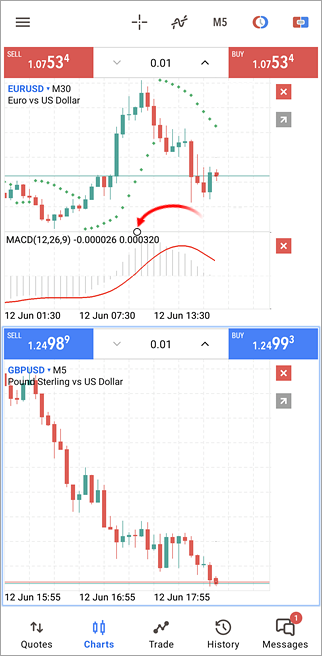
If you want to resize an indicator sub window, long tap (about 1 second) anywhere on the chart. Specify the desired sub window size by dragging its upper border.
In the same mode, you can change the shift of the price chart from the right edge of the window by dragging the dotted line.
In order to close a chart tap  next to it. next to it.
Tap anywhere on the chart to exit the edit mode.
|
Chart settings
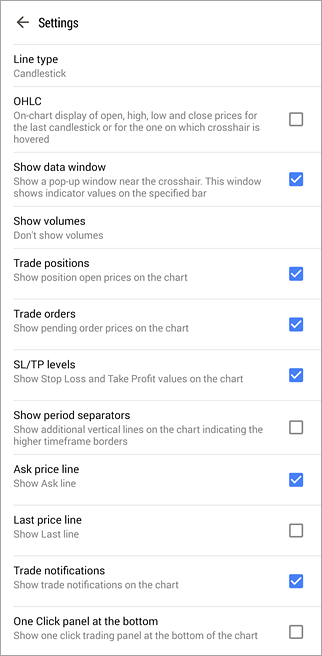
To go to the chart settings, open the radial menu and tap  . .
-
Chart view
– select representation of charts:
-
Bar chart
– show the chart as a sequence of bars.
-
Candlestick
– show the chart as a sequence of Japanese candlesticks.
-
Line chart
– show the chart as a broken line that connects close prices of bars.
-
OHLC
– when this option is enabled, current Open, High, Low and Close prices are displayed at the top of the chart. Therefore, the exact value of the last bar can always be seen.
-
Show data window
– when this option is enabled in the "Crosshair" mode, the data window will additionally be displayed on a chart. The Data Window displays the values of all active indicators in a specified point of a chart.
-
Show volumes
– volume display options:
-
Don't show volumes
-
Show tick volumes
|
|
-
Show trade levels
– when this option is enabled, all current positions and pending orders of a symbol are shown on the symbol chart. Trade operations are displayed as lines with signatures at the level of the price, at which they were executed.
-
Independent charts
– if this option is enabled, analytical objects are only created on the current symbol chart and on selected timeframes. When you switch to other symbols/timeframes, the objects will be hidden.
-
Show period separators
– date and time of each bar are displayed on the horizontal axis of the chart. And this horizontal scale interval is the selected timeframe. The "Show period separators" option draws additional vertical lines corresponding to the larger period (timeframe) borders. Daily separators are drawn for M1 to H1 charts, weekly separators are shown for H4, monthly appear for D1 and year separators are used for W1 and MN1 charts.
-
Ask price line
– show/hide the Ask price level of the latest quote. Bars in the platform are formed based on Bid prices (or Last prices if the depth of market is available for the instrument). However, at opening of long positions and closing of the short ones, the Ask price is always used. The Ask price is not displayed on the chart, so it cannot be seen. To have a more precise control over trading, enable the "Ask price line" parameter. An additional horizontal line corresponding to the Ask price of the latest quote appears on the chart.
-
Colors
–
select the color display of the chart and its various elements:
-
Scheme
– select a pre-defined color scheme of the chart. Two color schemes options are available: "Green on Black" and "Black on White".
-
Foreground
– color of the axes, scale and OHLC line;
-
Grid
– grid color;
-
Volumes
– the color of volumes and position opening levels;
-
Bar up
– color of an up bar, its shadow and border of a bullish candlestick's body;
-
Bar down
– color of down bar, its shadow and border of bearish candlestick's body;
-
Bull candle
– color of bullish candlestick's body;
-
Bear candle
– color of bearish candlestick's body;
-
Line chart
– color of the chart line and Doji candlesticks;
-
Bid price line
– color of the Bid price line;
-
Ask price line
– color of the Ask price line;
-
Stop levels
– the color of the levels of stop orders (Stop Loss and Take Profit).
|
|
How To Trade
The basis of the profit while working in the financial markets is a simple rule: buy cheap and sell dear. One of the main functions of the MetaTrader 5 mobile platform for Android is providing a user with wide opportunities to perform buy and sell operations.
The "Trade" tab features the current state of a trade account, as well as current positions and pending orders. To switch to this tab, use the application side panel that opens at a tap on
 .
.
To go to placing of a new order, tap on  on the top panel. on the top panel.
Account state
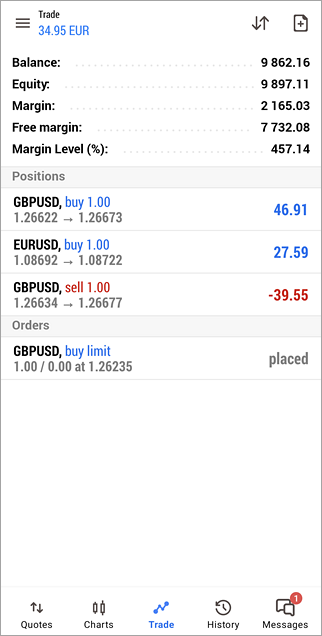
The current state of a trade account is shown at the top of the tab:
|
|
-
Profit, currency
– the total returns of the current trade positions and the account deposit currency.
-
Balance
– money on the account, not accounting for the results of currently open positions (deposit);
-
Credit
– amount of funds provided to a trader by a broker as a loan;
-
Assets
– the current value of purchased financial instruments (of long positions) defined in trader's deposit currency. The value is determined dynamically based on the price of the latest symbol deal taking into account the liquidity margin rate. In fact, the amount of assets is equivalent to the amount of money that the trader would receive in case of immediate closure of long positions. This rate is used on exchange markets.
-
Liabilities
– obligations on current short positions calculated as the value of these positions at the current market price. In fact, the amount of liabilities is equivalent to the amount of money that the trader would pay in case of immediate closure of short positions.
-
Commission
– commission by orders and positions accumulated during a day/month. Depending on conditions of collection of commission (determined by broker), a preliminary calculation of commission is performed during a day or a month. The corresponding amount of assets is blocked on the account and its value is shown in this field. Final commission calculation is performed at the end of a day/month, and the appropriate sum is withdrawn from the account by the balance operation (it is displayed as a separate deal on the History tab), while the blocked amount is unlocked. In case commission is charged immediately during a deal, its value is shown in the "Commission" field on the history tab.
-
Blocked
– under certain trading conditions (determined by a broker), a profit fixed during a day cannot be used to perform trade operations (not included in the free margin). This blocked profit is displayed in the "Blocked" field. At the end of the trading day, this profit is unblocked and deposited to the account balance.
-
Equity
– equity is calculated as Balance + Credit - Commission +/- Floating profit/loss - Blocked;
-
Margin
– money required to cover open positions and pending orders;
-
Free Margin
– the free amount of money that can be used to open positions. It is calculated as Equity - Margin. Depending on the trading conditions (defined by a broker), the equity value may or may not consider: floating profit, floating loss or floating profit and floating loss together;
-
Margin Level
– percentage of the account equity to the margin volume (Equity / Margin * 100);
-
Total of deals
– total financial result of all open positions.
|
|
|
Trading Commands
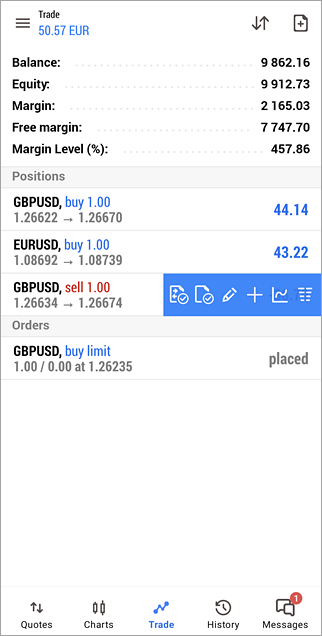
To quickly modify or close a position or order, swipe on its row from right to left. This will open a menu of commands:
The following commands are available here:
-
 – close position/delete order.
-
 – modify position/modify order.
-
 – increase position/place an order at the same symbol.
-
 – open a chart of the symbol the open position or placed order.
-
 – open the Market Depth of the symbol the open position or placed order.
|
Sorting positions and orders
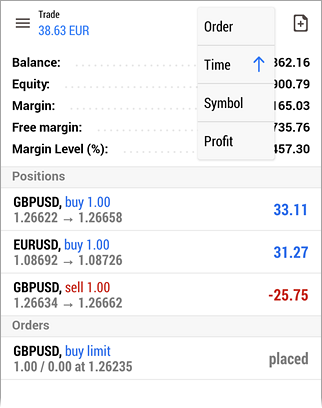
To sort open positions and pending orders, tap  on the top panel. on the top panel.
Trading operations can be sorted by symbol, ticket, time, and profit. For a reverse sorting by the selected parameter, tap on it again.
Sorting to positions and orders is applied separately.
|
|
Positions
Current open positions are shown in this part. By default, only brief information about positions is shown here. To see more details, tap once on the position line.

-
Symbol
– a financial instrument of the open position;
-
Type
– position type: "Buy" – long, "Sell" – short;
-
Volume
– volume of a trade operation (in lots or units). The minimal volume and its change step are limited by a brokerage company, the maximal one – by the deposit size.
-
Price
– the price of a deal, as a result of which the position was opened. If the opened position is a result of execution of several deals, then this field displays their weighted average price: (price of deal 1 * volume of deal 1 + ... + price of deal N * volume of deal N) / (volume of deal 1 + ... + volume of deal N). The accuracy of rounding of the the weighted average price is equal to the number of decimal places in the symbol price plus three additional characters.
-
Price
– the current price of the financial symbol.
-
Profit
– the financial result of the deal execution, taking into account the current price. A positive result indicates the profitability of the deal, negative indicates loss.
-
Time
– time when the position was opened. The record is represented as YYYY.MM.DD HH:MM (year.month.day hour:minute).
-
Comment
– a comment to a position. A comment can be added only when placing an order from the PC version of the MetaTrader 5 platform. The comment cannot be changed when modifying an order. In addition, a comment on a trade operation can be added by a brokerage company.
-
S/L
– the Stop Loss level of the current position. If the order has not been placed, a zero value is displayed;
-
T/P
– the Take Profit level of the current position. If the order has not been placed, a zero value is displayed;
-
Swap
– amount of swaps charged.
-
Commission
– commission charged by a brokerage company for the execution of the trade operation.
Orders
Pending orders placed are shown in this part. By default, only brief information about orders is shown here. To see more details, tap once on the order line.

-
Symbol
– the financial instrument of the pending order.
-
Type
– type of the pending order: "Sell Stop", "Sell Limit", "Buy Stop", "Buy Limit", "Buy Stop Limit" or "Sell Stop Limit";
-
Volume
– volume requested in the pending order, and volume covered by the deal (in lots or units).
-
Price
– price reaching which the pending order will trigger;
-
State
– the current status of the pending order: "Started", "Placed" etc.
-
Time
– pending order placing time. The record is represented as YYYY.MM.DD HH:MM (year.month.day hour:minute).
-
Comment
– a comment to the order. A comment can be added only when placing an order from the PC version of the MetaTrader 5 platform. The comment cannot be changed when modifying an order. In addition, a comment on a trade operation can be added by a brokerage company.
-
S/L
– level of the placed Stop Loss order. If the order has not been placed, a zero value is displayed;
-
T/P
– level of the set Take Profit order. If the order has not been placed, a zero value is displayed.
-
Price
– the current price of the financial symbol.
-
#
– ticket number (a unique identifier) of the pending order.
|
When approaching the market, the order background is colored in green.
|
Context Menu
The context menu can be called for a position or an order only when viewing detailed information. To expand information about a position or an order, tap once on its line. To display a context menu, tap and hold on the line for a second.
Position Context Menu
-
Close position
– go to position closing.
-
New order
– open the trade tab. In this case, the symbol and volume of the trade operation are automatically set in accordance with the position, on which the context menu is called.
-
Modify position
– modify the Stop Loss and Take Profit levels of a position.
Order Context Menu
-
Modify order
– open the window of order modification.
-
Delete order
– go to order canceling.
The Menu button
The Menu button on your device calls a menu with additional commands:
-
New order
– go to placing a new order.
-
Symbols
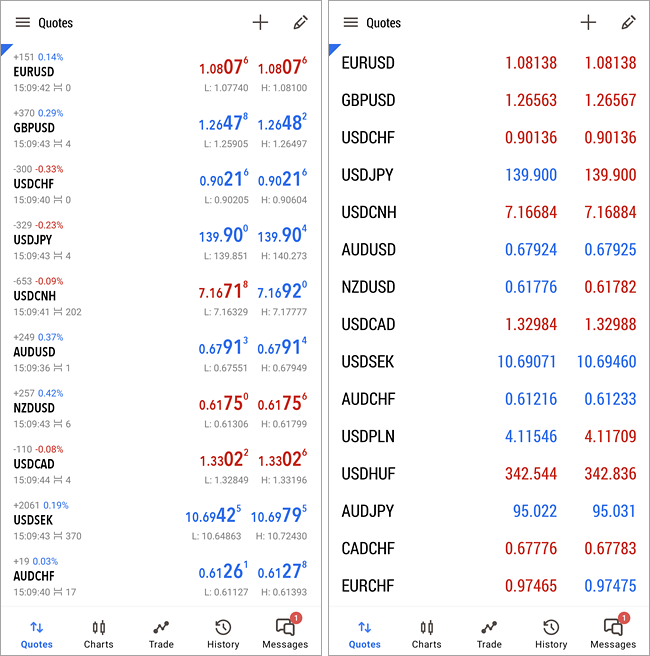
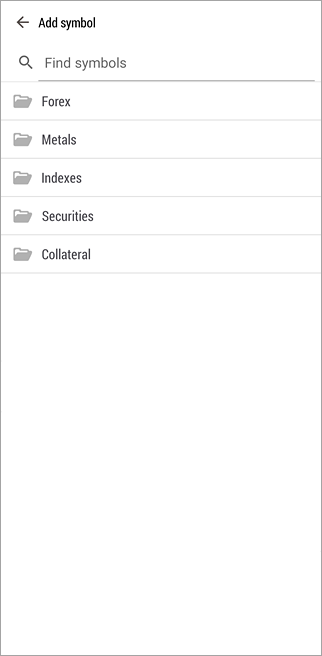
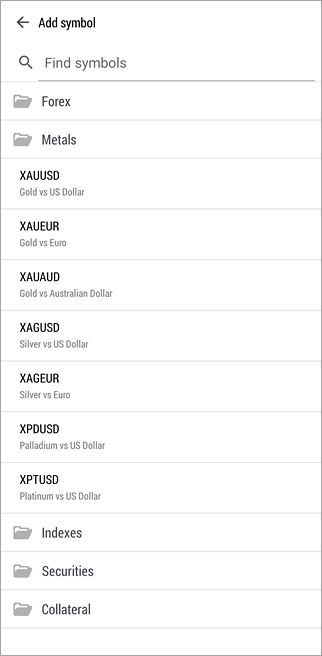
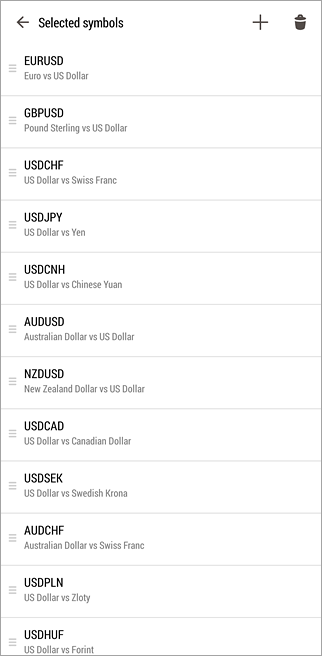
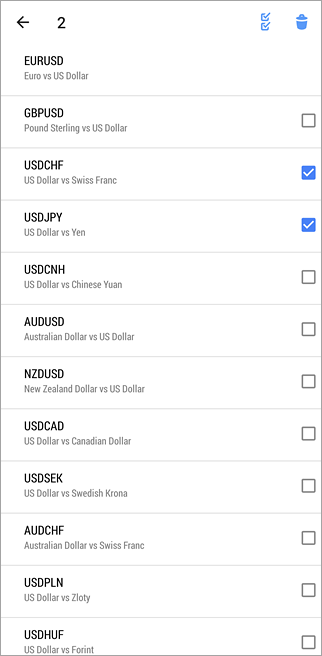
– configure the lists of symbols shown on the "Quotes" TAB.
-
Accounts
– manage trade accounts.
-
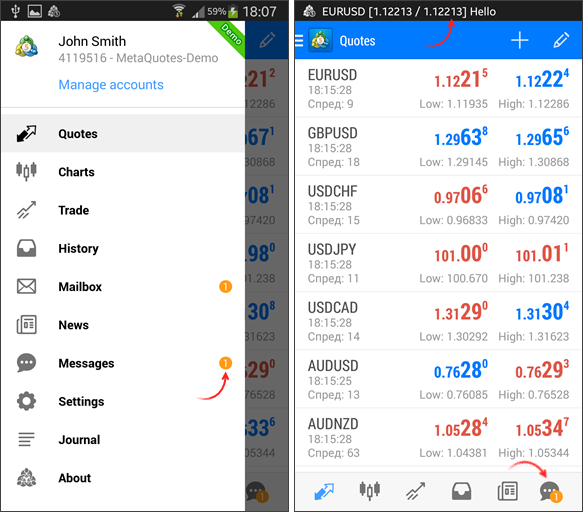
Messages
– view push notifications.
-
Settings
– go to the settings of the MetaTrader 5 for Android.
-
About
– view information about the program.
|
|
Accounts
This section allows you to manage your trading account. To switch to it, use the application side panel that opens at a tap on
 .
.
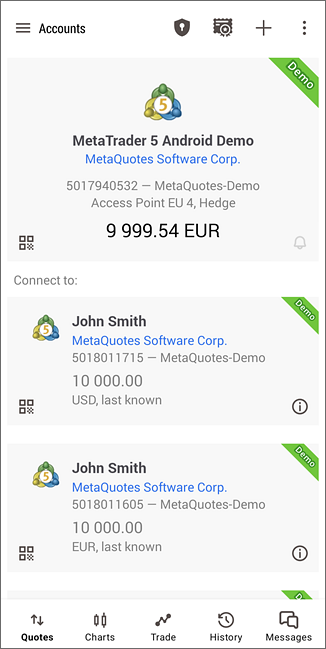
The number of the currently connected account is show at the top of the window. Below connection parameters are shown:
-
Server
– the name of the server, to which the mobile terminal is currently connected.
-
Point
– the name of the access point, through which the terminal is currently connected to a server.
Amount of incoming and outgoing traffic for
the current session of the MetaTrader 5 for Android is shown in the bottom part.
Tap  to find detailed information about the account – its number, name of the owner, the trade server, the amount of leverage and balance. to find detailed information about the account – its number, name of the owner, the trade server, the amount of leverage and balance.
|
|
Account Management
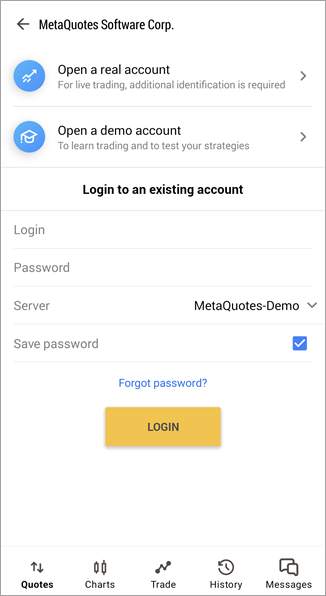
Each account that is used for the connection is saved in the list. In order to connect to the account, just tap on its line or select "Login" in its context menu.
-
Adding accounts
– to open a new demo account or connect using details of a previously opened account tap
 at the top of the window. at the top of the window.
-
Deleting accounts
– to delete an account from the list, open a context menu by touching and holding (for about 1 second) the account line. Then select "Delete".
Managing Certificates
The trading platform provides the option of extended authentication using SSL certificates greatly increasing the system security. Press  . .
One Time Passwords
Use of OTP (one-time passwords) provides an advanced level of security when working with trading accounts. The user is required to enter a unique one-time password every time to connect to an account.
In order to open the one-time password generator, tap  . .
Connection Status
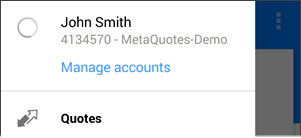
The status of connection to the server can be tracked through the side panel of the application. A rotating indication next to an account number means the app is not connected to the server.
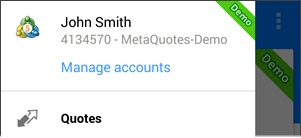
A trading platform icon next to the account number is an indication of an active account connection.
|
|
|
Mail
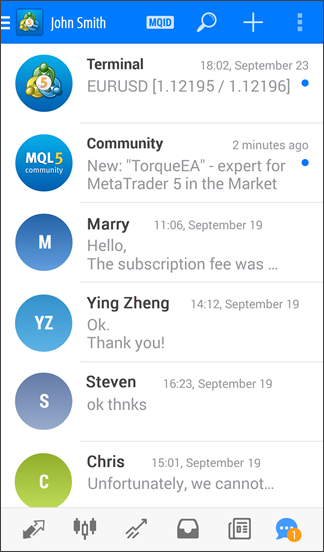
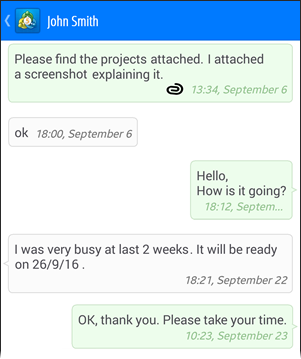
The section allows you to work with the internal MetaTrader 5 mail system. All mails sent by a brokerage company are displayed here. Also, you can send a mail to the company's administrator if you have any questions.
The mail's subject, sender's name and a date are displayed in the list. To view an email, tap on it.

The headers of unread mails in the list are displayed in bold.
|
Writing a Mail
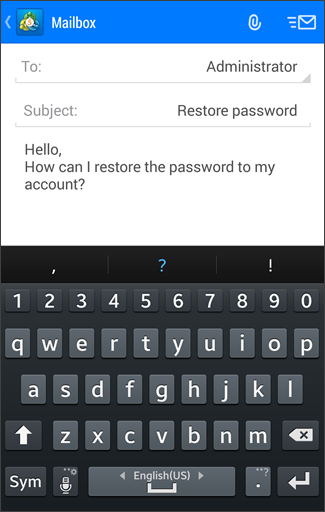
To create a new mail, tap  button in the upper right corner of the screen. To reply an incoming mail, enter it and tap button in the upper right corner of the screen. To reply an incoming mail, enter it and tap  . .
Select one of the available administrators in the 'To' field. Enter the mail's subject to Subject field. The text of a mail is entered below. To send an email, tap  button in the upper right corner of the screen. button in the upper right corner of the screen.
You can attach image files and application logs to your email. Tap  and choose an attachment option: and choose an attachment option:
-
Camera – open a camera to take a picture of the document. Before sending, you can view the image or take a new photo if necessary.
-
File – upload an image from the smartphone memory. Only the images that you select will be used.
|
|
|
|
Deleting Mails
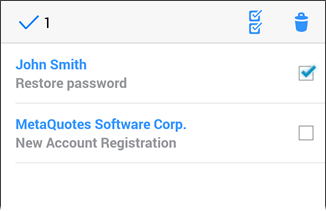
To delete emails, tap  at the top of the window. Then tick off all the messages you want to delete and once again tap at the top of the window. Then tick off all the messages you want to delete and once again tap  . To select all emails, tap . To select all emails, tap  . .
|
|
|
|
|
|
|
|

